
Welcome to the daily financial report about the Hive blockchain.
All the information presented in this report is based on the data collected from the blockchain until 2021-11-29 midnight UTC. This report aims to provide you with a clear view of what is happening on the Hive blockchain.
 Este post está traducido al español - aquí
 Dieser Beitrag ist ins Deutsche übersetzt - hier
 Une version en français de ce post est disponible - ici
1. Price
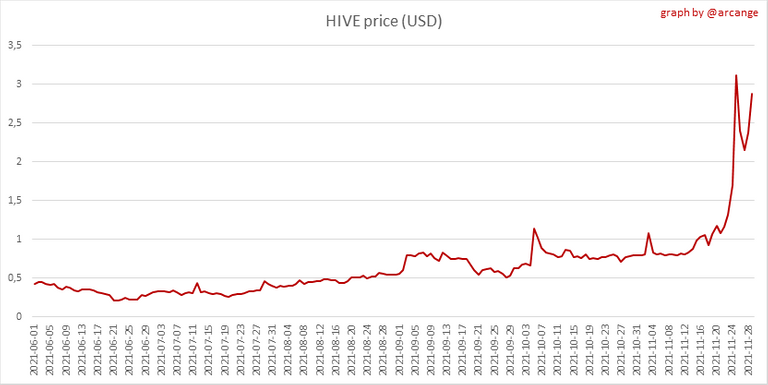 | 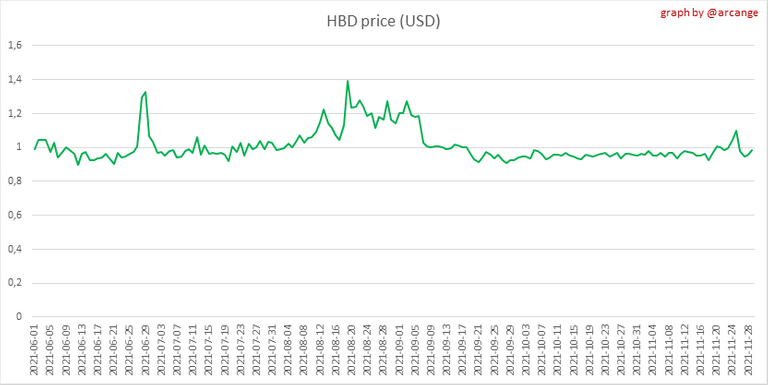 |
These graphs show the evolution of prices in USD for HIVE and HBD.
2. Supply
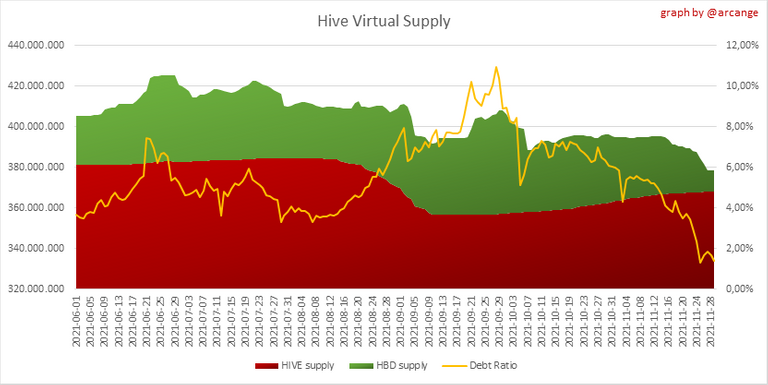
This graph shows the evolution of HIVE virtual Supply. The virtual supply is the sum of HIVE supply (liquid and staked HIVE) and HBD supply (converted into HIVE).
The graph also displays the debt ratio (HBD supply / HIVE virtual supply). Keep in mind that since hardfork 24 funds in the treasury (@hive.fund HBD balance) don't count towards the HBD debt ratio.
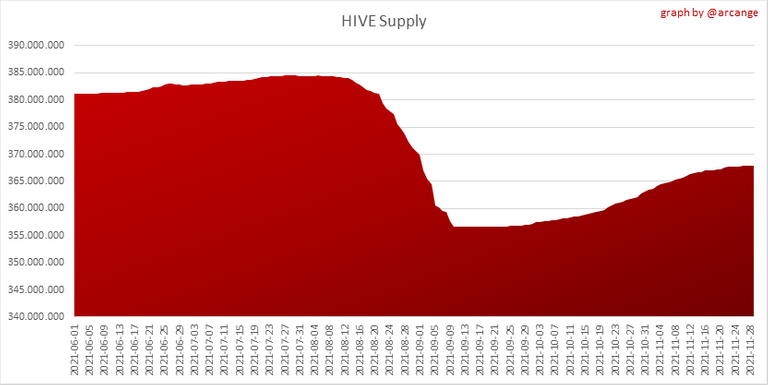 | 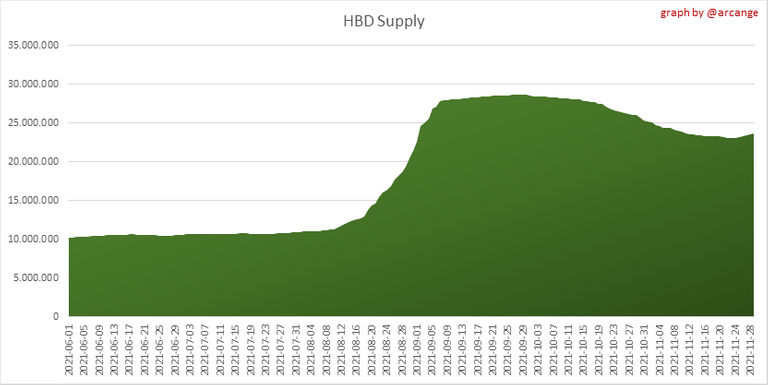 |
These graphs show the evolution of the HIVE Supply (both liquid and staked) and the HBD supply.
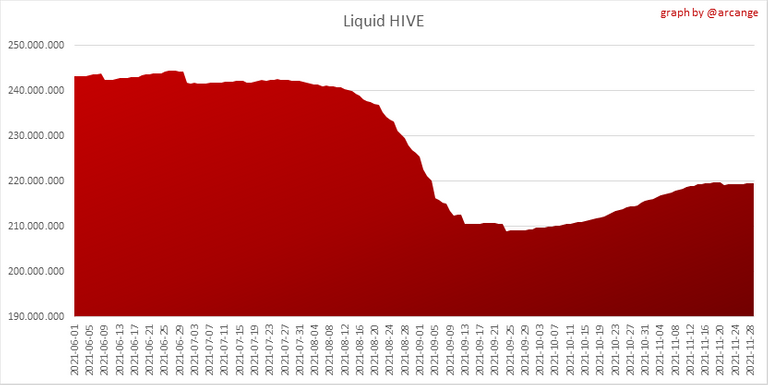 | 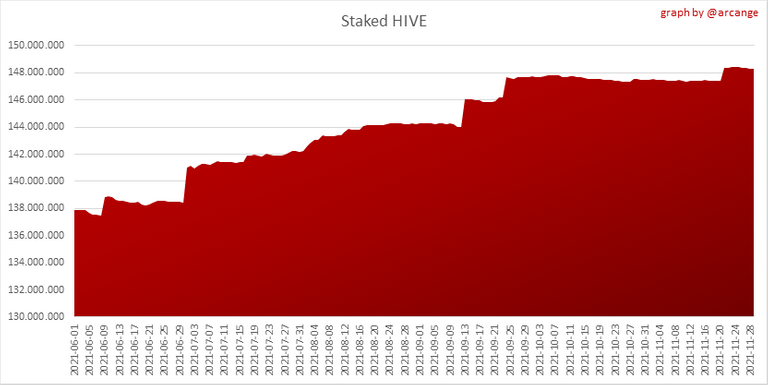 |
These charts show the evolution of the liquid HIVE and the staked HIVE (Hive Power).
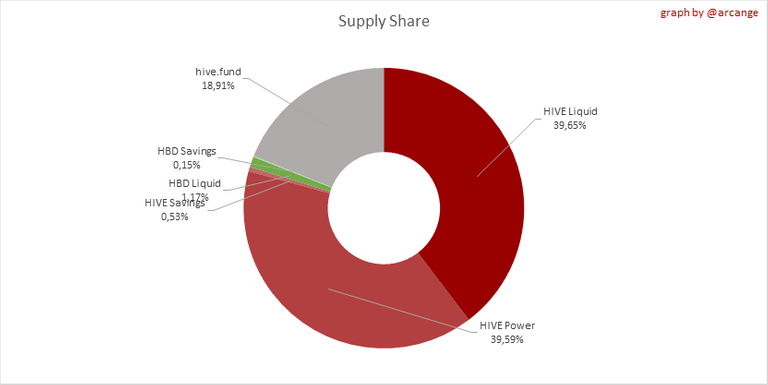
This graph shows the overall Hive tokens distribution.
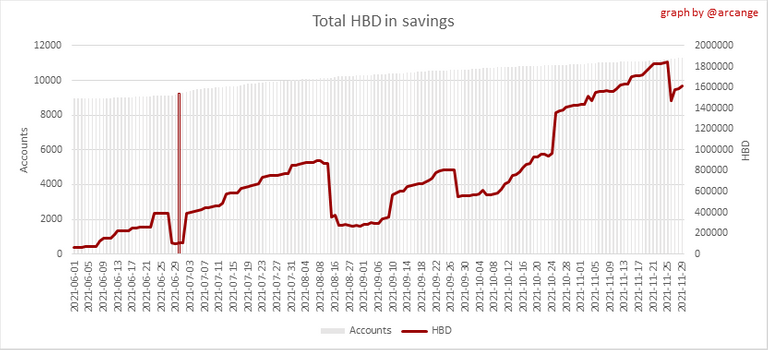
3. HBD Savings
Note: As of 2021-06-30 (HF25) interest is only paid for HBD which are stored in savings.
| Account | Deposit | Account | Withdrawal |
|---|---|---|---|
| @strawhat | 8,074.916 HBD | @mika | 400,000.000 HBD |
| @engrave.cold | 6,420.517 HBD | @brumest | 1,728.164 HBD |
| @badtman | 2,600.000 HBD | @monochromes | 1,538.310 HBD |
| @artsyproxy | 2,113.960 HBD | @visionaer3003 | 1,215.000 HBD |
| @teammo | 2,050.994 HBD | @aafeng | 651.190 HBD |
| @robibasa | 1,274.989 HBD | @photographercr | 177.285 HBD |
| @rivalhw | 1,000.000 HBD | @dagobert007 | 160.000 HBD |
| @buggedout | 902.457 HBD | @city-bounter | 122.843 HBD |
| @yunnie | 892.786 HBD | @antisocialist | 111.890 HBD |
| @palasatenea | 600.000 HBD | @sam1965uk | 100.440 HBD |
This graph shows how much and how many accounts store HBD in savings. The table below shows the topmost HBD deposits and withdrawals of the day.
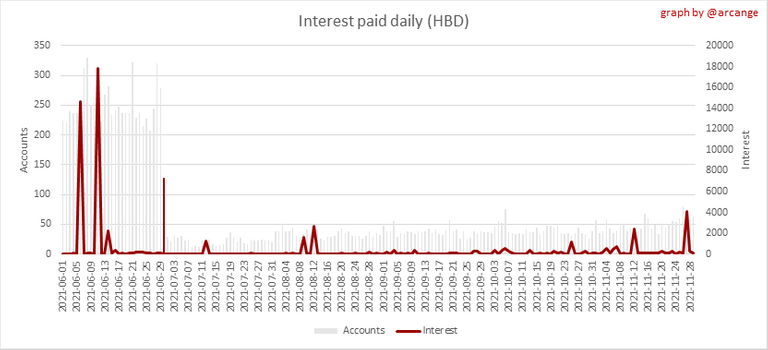
This chart shows the amount of interest paid each day for holding HBD and how many accounts received such interest.
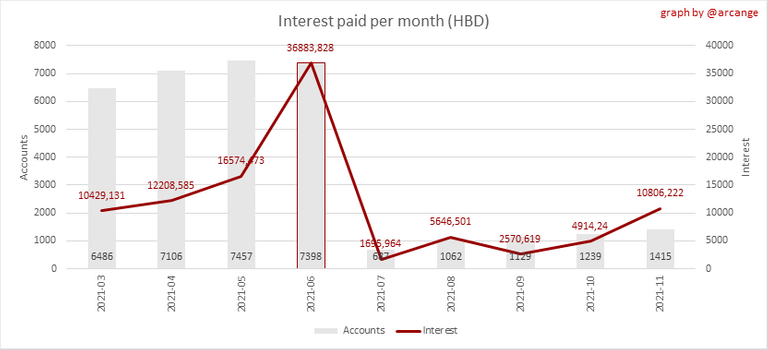
This chart is the same as the previous one, but data are grouped by month.
4. Balances
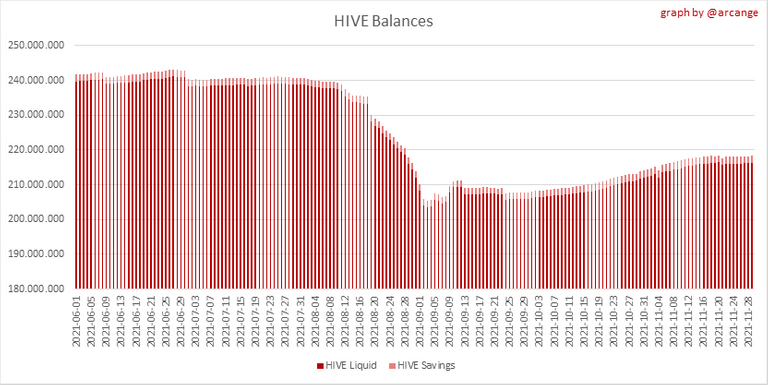
This graph shows the number of HIVE, both liquid and in savings, held by all accounts.
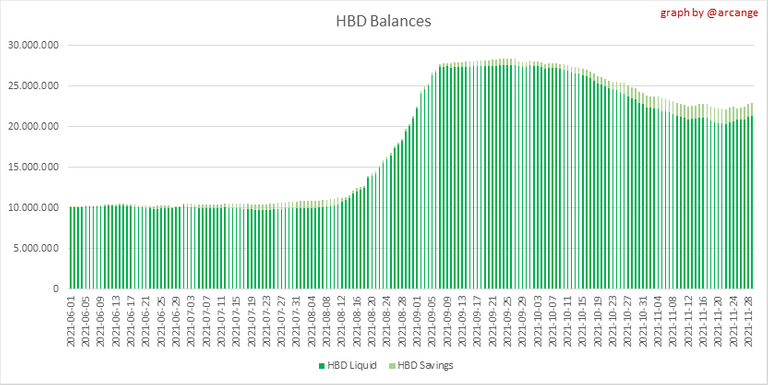
This graph shows the number of HBD, both liquid and in savings, held by all accounts.
5. Conversions
Note: As a reminder, conversion requests are only finalized after 3 days. It is only then that it is known exactly how many HIVE were burned in return for the HBD received at the time of the conversion request.
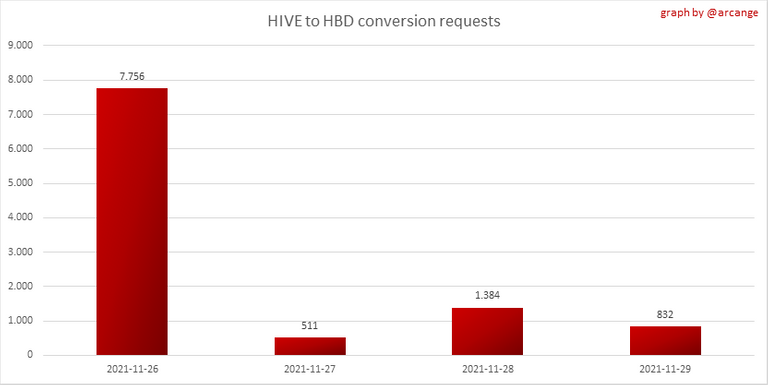
This graph shows the number of HIVE collateralized due to requests to convert HIVE to HBD over the past few days.
 | 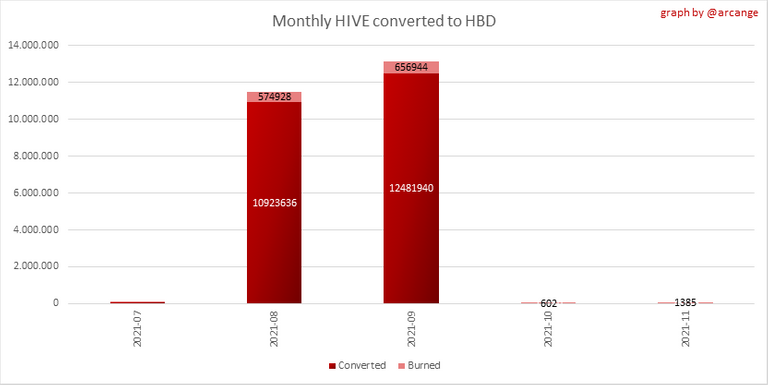 |
These graphs show the number of HIVE effectively used by the conversion process (HIVE converted and 5% HIVE fee which is burned) each day and month when requests to convert HIVE to HBD have been finalized.
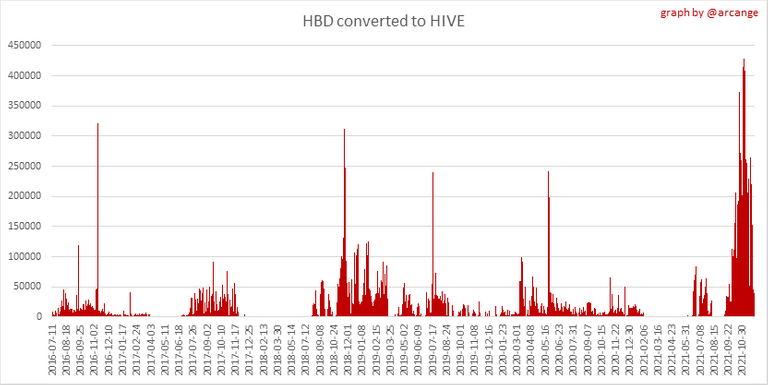 | 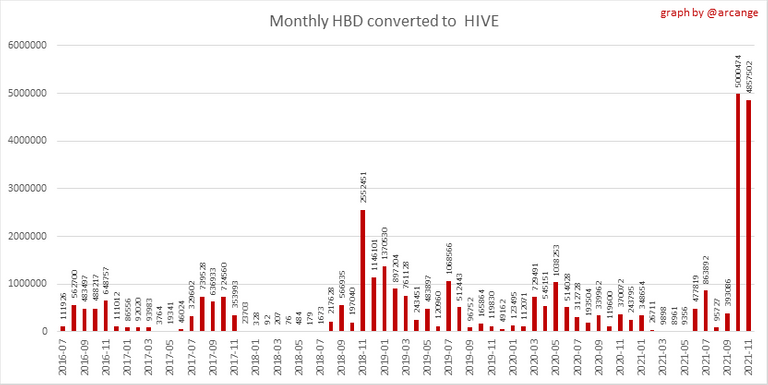 |
These graphs show the number of HBD burned, each day and each month, following requests to convert HBD to HIVE.
6. Powerup and Powerdown
| Date | Account | Amount |
|---|---|---|
| 2021-11-29 03:05:39 | @geekgirl | 53,975.326 HIVE |
| 2021-11-29 06:49:09 | @revisesociology | 48,483.558 HIVE |
| 2021-11-29 11:40:18 | @steemcleaners | 34,287.783 HIVE |
| 2021-11-29 03:22:39 | @improv | 33,582.129 HIVE |
| 2021-11-29 09:18:00 | @niallon11 | 30,003.117 HIVE |
| 2021-11-29 09:58:27 | @fedoraonmyhead | 19,223.216 HIVE |
| 2021-11-29 12:10:21 | @celestal | 15,763.492 HIVE |
| 2021-11-29 05:06:24 | @intrepidthinker | 13,695.567 HIVE |
| 2021-11-29 12:02:57 | @winniex | 10,834.085 HIVE |
| 2021-11-29 10:48:30 | @laruche | 9,284.562 HIVE |
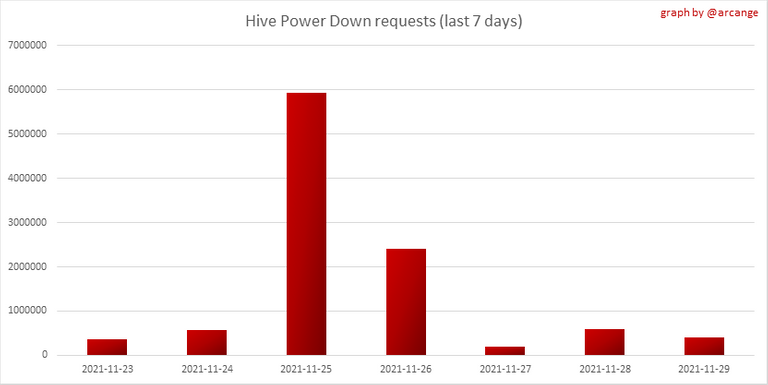
This graph and table show the amount of powerdown initiated over the last 7 days, and the largest initiated on this day.
| Account | Powerup | Account | Powerdown |
|---|---|---|---|
| @fujifluz42 | 1,980.920 HIVE | @gringalicious | 14,940.377 HIVE |
| @apprentice212071 | 641.530 HIVE | @peakd | 12,363.537 HIVE |
| @sbi2 | 531.723 HIVE | @abh12345 | 7,485.070 HIVE |
| @bethalea | 503.424 HIVE | @aggroed | 6,956.049 HIVE |
| @clfoojmf | 316.866 HIVE | @xxxxxxxxxx | 3,246.365 HIVE |
| @pipoune | 259.495 HIVE | @eric818 | 2,935.140 HIVE |
| @nothingbutbass | 206.415 HIVE | @niallon11 | 2,001.096 HIVE |
| @torran | 198.001 HIVE | @leo.voter | 1,904.364 HIVE |
| @mcoms1 | 147.842 HIVE | @juancar347 | 1,623.088 HIVE |
| @simon888 | 134.855 HIVE | @world-travel-pro | 1,594.214 HIVE |
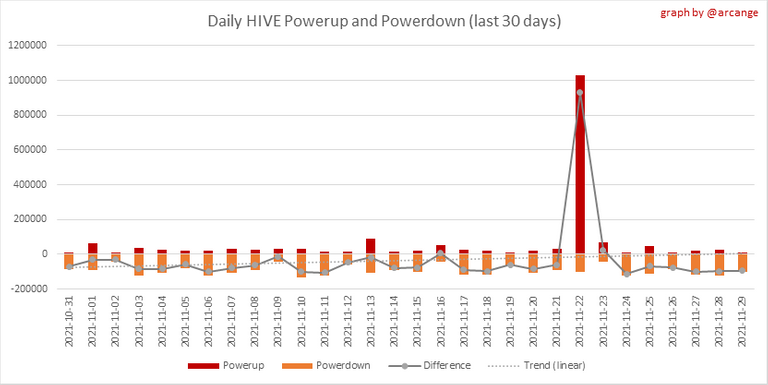
This graph shows the daily HIVE power-up, power-down, and the resulting variation over the last 30 days. The table shows the topmost power-ups and power-downs of the day.
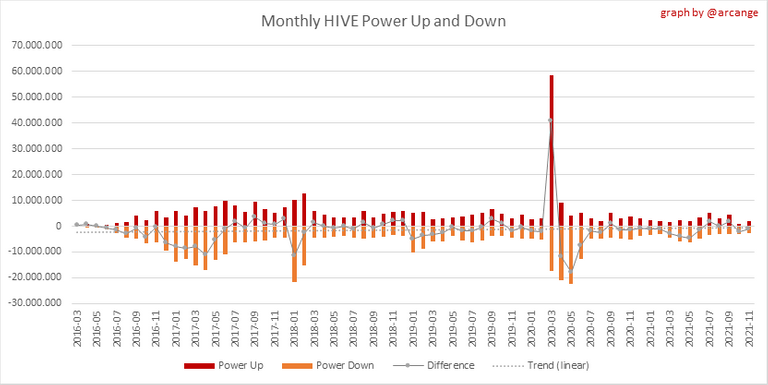
This graph shows the monthly HIVE power-up, power-down and the resulting variation.
Values for the last 3 months
| Period | Powerup | Powerdown | Difference |
|---|---|---|---|
| 2021-11 | 1,821,053.000 | 2,783,591.000 | -962,538.000 |
| 2021-10 | 951,900.000 | 3,051,364.000 | -2,099,464.000 |
| 2021-09 | 4,552,777.000 | 2,892,984.000 | 1,659,793.000 |
7. Transfers
These graphs show the volume (in USD) of HIVE and HBD transferred between accounts.
8. Exchanges
 | 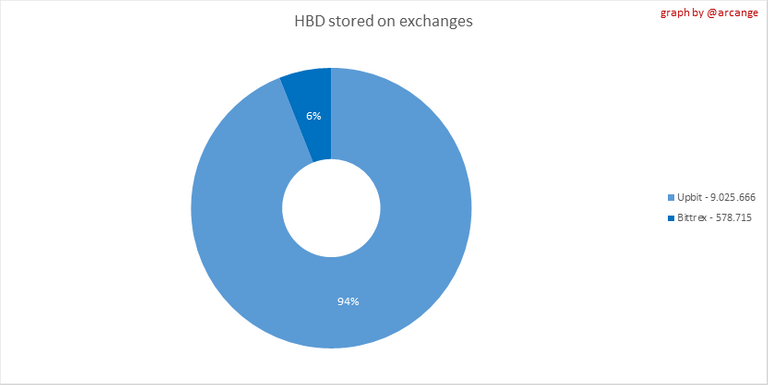 |
These graphs show the amount and distribution of HIVE and HBD stored on the exchanges where they are listed.
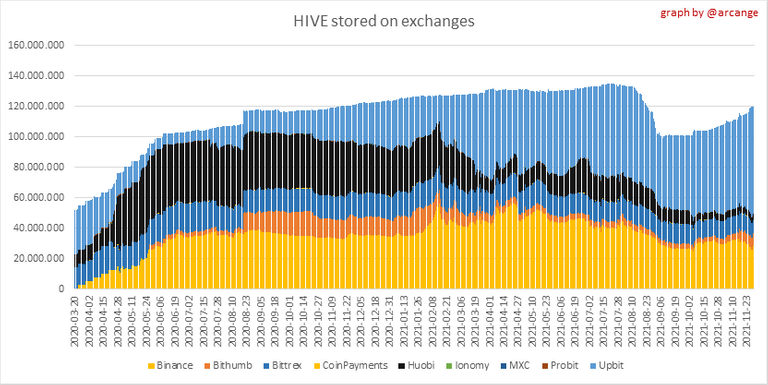 | 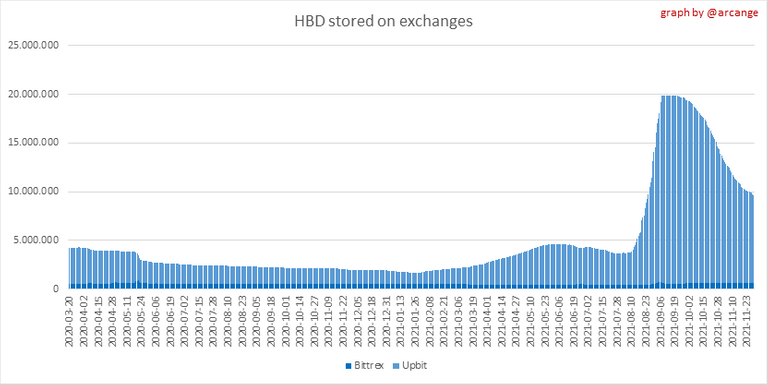 |
These graphs show the daily evolution of HIVE and HBD stored on the exchanges where they are listed.
I hope you find those stats useful. If you would like to see additional stats, feel free to drop me a comment. Your feedback is than welcome.
Thanks for reading.
Check out my apps and services


I guess it been a while on the hive statistics boss
Thank you for this excellent collection of data and reminding me how ignorant I am on Hive tokenomics.
I even can't figure out how to interprete Hive virtual supply graph.
Yet let me show a perfect example of Dunnig-Kruger impulse and comment - disregarding the probability that I am not really the target audience of this post :)
An interesting indicator should be how much hive - hbd going out to exchanges and how much coming in for the defined period of time. It would show a really interesting trend.
Yet I think people would be interested in the variation of the reward pool since this will diretly impact the value of the upvotes.
Your post gave me motivation to learn more.
FD
Thanks „ your excellent.
Congratulations @arcange! You received a personal badge!
Participate in the next Power Up month to get another one!
You can view your badges on your board and compare yourself to others in the Ranking
Check out the last post from @hivebuzz:
Congratulations @arcange! You received a personal badge!
Wait until the end of Power Up Day to find out the size of your Power-Bee.
May the Hive Power be with you!
You can view your badges on your board and compare yourself to others in the Ranking
Check out the last post from @hivebuzz: