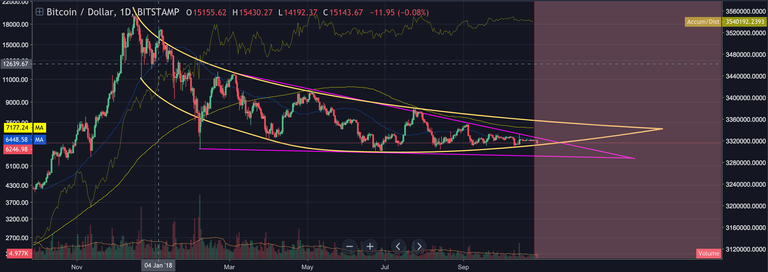
Looking at the daily chart , we can see through the ADL indicator a major divergence (while prices kept going down, ADL sustainedly moved up). Last time this happened was before the rally of Jan 2015.
Just looking at this indicator and the fact that support has held for the past few weeks, it is possible that we are cruising a major accumulation phase.
Also, the 2 parabolic trendlines (yellow) marking support/resistance have been steadily been maintained since I drew them 2 months ago. They are starting to form the second half of a Cup&Handle formation.
My 2 mid term targets are defined by the Apex of the descending triangle ( bearish possibility) and the parabolic trends (yellow). I´m leaning towards the latter. I am not worried about another bearish move as I think it will probably not be that significant.
I remain long on BTC. I do not think a potential move to the downside could take us to below 5800.
Institutional money getting into crypto and creating crypto products/platforms legitimize the ecosystem. Right now I see a high probability of an inverse Bart Simpson in the making.
I also think the next 2 years should see a culling of crypto projects. 1500 crypto startups popped during the past 2 years... most of them should not make it. As they go down I envision crypto slowly flowing back into BTC and the main/surviving alts.
Congratulations @ftarnogol! You received a personal award!
You can view your badges on your Steem Board and compare to others on the Steem Ranking
Vote for @Steemitboard as a witness to get one more award and increased upvotes!