BITCOIN UPDATE
BTC looks set to make further gains amid mixed action in the crypto markets.
Having hit a four-day high of $8,621.27 yesterday, CoinDesk's Bitcoin Price Index (BPI) fell to $7,754.67 at 05:29 UTC today. As of writing, prices had bounced back to $8,284. The cryptocurrency has depreciated by 0.4 percent in the last 24 hours, according to data source CoinMarketCap.
Meanwhile, bitcoin (BTC) offshoot bitcoin cash has strengthened by 25 percent in the last 24 hours, while Ripple's XRP token is reporting a 3 percent rise. The losing side includes names like Ethereum's ether token, Cardano, Stellar and NEO, which are all showing slight dips.
Bitcoin's retreat from $8621.27 to $7,754 coincided with a 1000 point drop in the Dow Jones Industrial Average (DJIA), reportedly due to a rise in U.S. bond yields and fears of higher inflation.
Reports are doing the rounds that the 90-day correlation between the daily percent returns of the cryptocurrency and the S&P 500 has jumped to 33 percent – the highest since January 2016.
Though this is up for debate, BTC's lackluster price action during the recent bout of equity market sell-off may discredit the theory often put forward that the cryptocurrency is a new safe haven asset like gold, the Swiss franc and treasuries.
So, for the time being, bitcoin and cryptocurrencies in general are unlikely to receive a shot in the arm due to instability in other markets.
Yet, bitcoin often confounds expectations, and the technical chart indicates scope for a rise to $9,000 over the weekend.
1-hour chart

The above chart (prices as per Coinbase) shows:
itemBTC has breached the rising trendline
itemBull flag pattern – a bullish continuation pattern – meaning an upside break signal continuation of the rally from Feb. 6 low of $5,873.
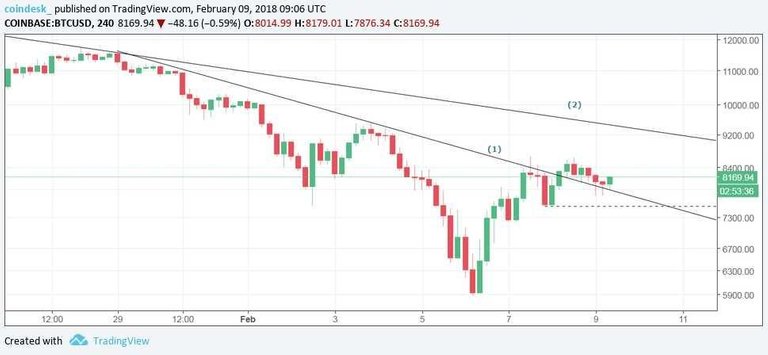
4-hour chart

The previous two candles had big tails (big gap between lows and close), indicating strong dip demand, and have also established $7,750 as strong support. The candles also indicate that the descending trendline (1) is now acting as a strong support.
Meanwhile, on the higher side, BTC may face strong resistance above $8,625 considering the fact that bulls have faced rejection $8,650 and $8,625 in the last 24 hours.
Back-to-back 4-hour candles with long tails at key trendline support indicate BTC could witness an upside break of the bull flag pattern.
The bullish breakout would be confirmed after 1-hour candle closes above the flag resistance. In such a scenario, prices could reach $9,000–$9,185 (target as as per the measured height method, i.e. pole height added to breakout price).
On the downside, a break below $7,535 (Feb. 7 low) would signal breach of higher lows pattern and open the door for a drop to $7,000 levels.
follow for more
New Free 100 GHS https://desmine.cc/ref?id=armour