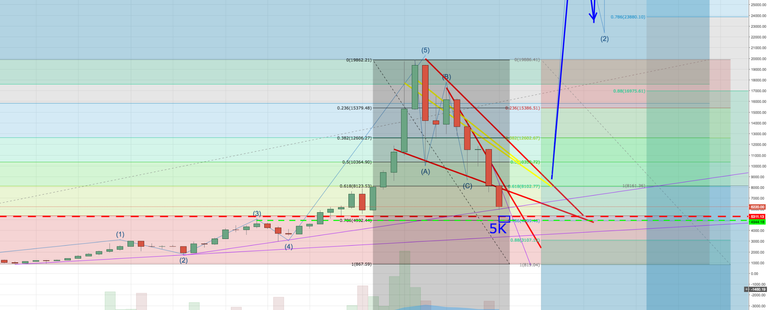
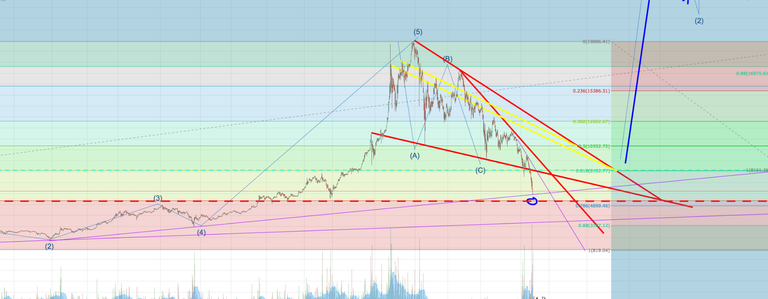
This is both a Fibonacci retracement chart from bottom to top, and the black from top to bottom.
Heading to the 0.786 reversal which is $5k if we cannot hold this trend line.
These are 1 week candlesticks.

day

This is not investment advise
This is both a Fibonacci retracement chart from bottom to top, and the black from top to bottom.
Heading to the 0.786 reversal which is $5k if we cannot hold this trend line.
These are 1 week candlesticks.

day

This is not investment advise