Hello Steemians and my followers,
couple months ago I made a post of 2018Y BTC correction comparison with 2014Y.
https://steemit.com/cryptocurrency/@andriustovis/bitcoin-update-and-comparison-with-historic-correction-in-2014
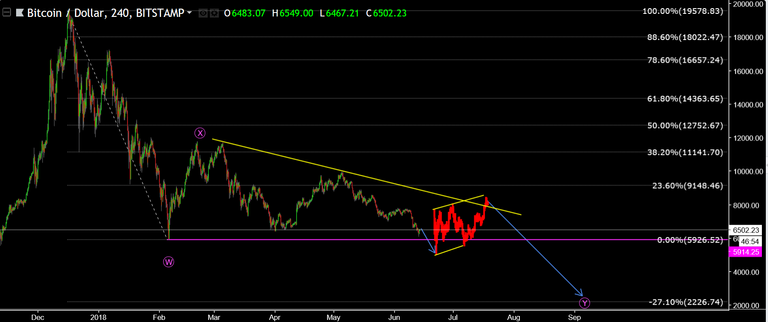
However my BTC prediction since that post went as I wasn't expected e.i. made much deeper pullback upside (marked as "B" wave in the chart below), so in later updates I change my prediction to this one:
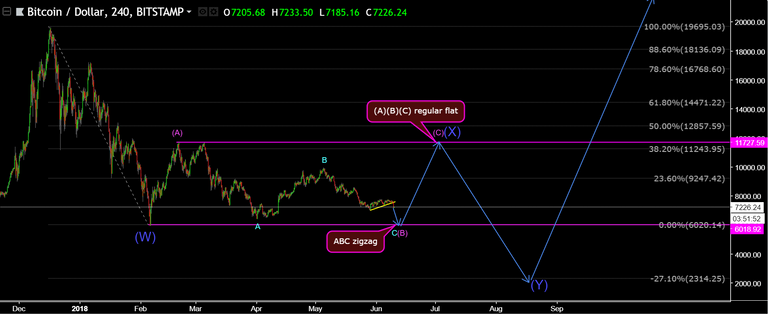
I still think this scenario is very much likely, but if it slightly breaks historic low and makes a bearish flag we will see 2014Y correction scenario!
Here's the comparicon for your assumptions:
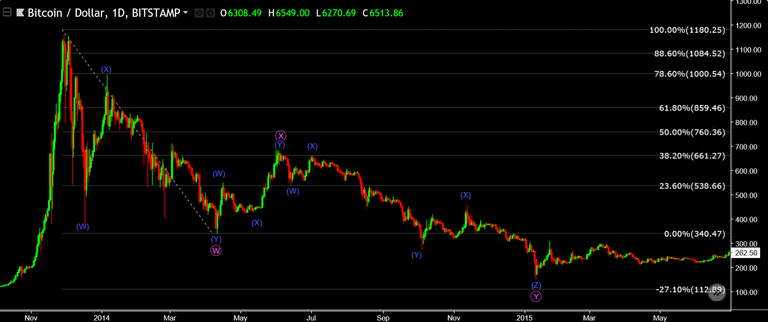
2014Y:
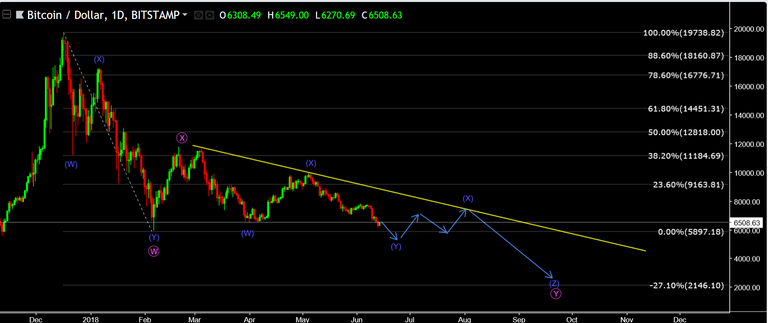
2018Y:
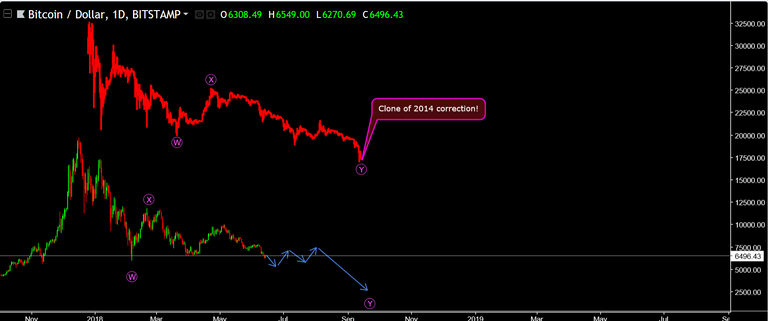
Both together:
IF YOU LIKE MY WORK, PLEASE UPVOTE AND RESTEEM THIS POST. THANK YOU!
Note: This is not a financial advise or trade call, it's only my personal opinion and arrows in the charts shows just an indication of direction, not the specific points or targets!
Your crypto_analyst
@andriustovis
Hello,
"but if it slightly breaks historic low and makes a bearish flag we will see 2014Y correction scenario!"
Can you please precise what historic low you mean?
I mean 5.9K$ (purple line in the chart):
Wasn't sure, thank you.
The prediction for SBD and Steem is the same?
It's very much likely and if so we may see such further development:
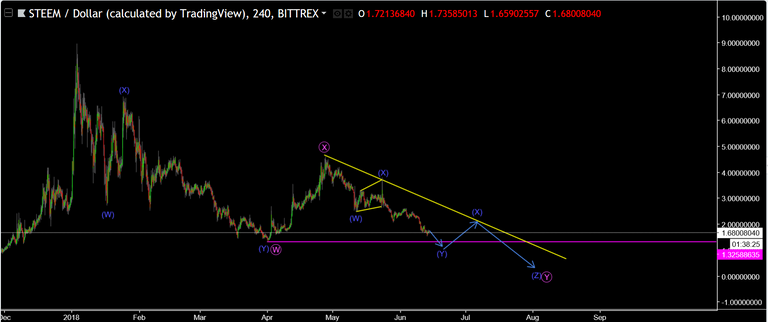
SBD similar view!
Volume is rising, we are going up.
I think it's only correction before next plunge! But let's see