
¿Qué es el RSI? El indicador RSI o Relative Strength Index, traducido como índice de fuerza relativa, es un oscilador que mide la fuerza del precio. Busca medir qué tan rápido sube o baja el precio de un activo en un periodo determinado.
Gráficamente el RSI tiene la forma de un oscilador que se mueve en un rango de 0 a 100.
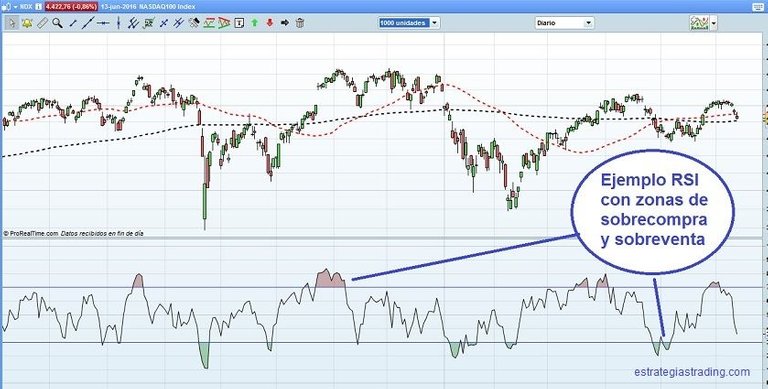
Para mi es una de las herramientas más fundamentales para utilizar, mientras tradeo o estoy operando ya como nos muestra la gráfica en distintas temporalidades. Podemos observar si un activo se encuentra en sobre compra o en sobre venta, como nos indica el oscilador sobre compra es que el activo se va ir a la alza y si está en sobreventa es a la baja.
¿Que significa sobrecompra y sobreventa en el indicador RSI?
La llamada zona de sobrecompra o sobreventa se da cuando el nivel del indicador se encuentra por encima o por debajo de un nivel establecido.
Cuando el RSI se sitúa en zona de sobrecompra se espera un agotamiento alcista y a la inversa para la sobreventa donde se espera que el precio remonte.
Por esto, una forma de operar con el RSI es, por ejemplo, con los sistemas de reversión a la media.
La estrategia de estos sistemas es entrar largos cuando el RSI cruza en sentido ascendente el nivel de sobreventa y cortos cuando el oscilador cruza en sentido descendente el nivel de sobrecompra. Por supuesto siempre teniendo en cuenta la dirección de la tendencia a largo plazo para entrar a favor de ésta. ( Un ejemplo de un sistema de trading basado en este oscilador es el sistema RSI 25/75).
fuente

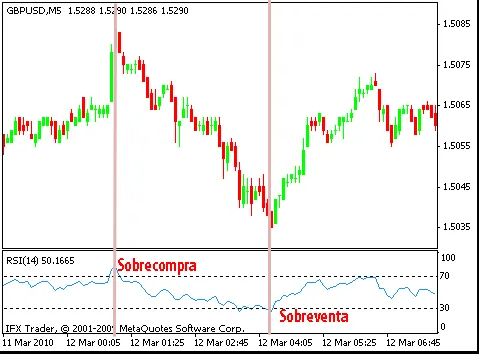
En esta gráfica nos muestra mucho mejor cuando estamos en sobre compra y en sobre venta, en cada uno en las tendencias que te va indicando el oscilador bien sea a la baja o al alza. Como recomendación debemos estar muy atentos a las señales que nos indica el mercado bien sea bajista o alcista no operar a la contra del mercado, tampoco sobre apalancarse mucho máximo un x3 ya que en cualquier movimiento brusco nos puede hacer perder nuestro dinero.
English :
What is the RSI? The RSI indicator, or Relative Strength Index, is an oscillator that measures the strength of the price. It seeks to measure how fast the price of an asset rises or falls in a given period.
Graphically the RSI takes the form of an oscillator that moves in a range from 0 to 100.
For me it is one of the most fundamental tools to use, while trading or trading as it shows us the graph in different timeframes. We can see if an asset is overbought or oversold, as the overbought oxylator indicates that the asset is going up and if it is oversold it is going down.
What does overbought and oversold mean in the RSI indicator?
The so-called overbought or oversold zone is when the level of the indicator is above or below an established level.
When the RSI is in the overbought zone, a bullish exhaustion is expected and vice versa for oversold where the price is expected to rally.
This is why one way to trade the RSI is, for example, with mean reversion systems.
The strategy of these systems is to enter long when the RSI crosses the oversold level upwards and short when the oscillator crosses the overbought level downwards. (An example of a trading system based on this oscillator is the RSI 25/75 system).
This graph shows us much better when we are in overbought and oversold, in each of the trends that the oscillator is indicating either downward or upward. As a recommendation we must be very attentive to the signals that indicate the market either bearish or bullish not operate against the market, not overleveraged much maximum x3 as any sudden movement can make us lose our money.
Translated with www.DeepL.com/Translator (free version)
Posted Using LeoFinance Beta
Congratulations @elchicocripto! You have completed the following achievement on the Hive blockchain and have been rewarded with new badge(s) :
You can view your badges on your board and compare yourself to others in the Ranking
If you no longer want to receive notifications, reply to this comment with the word
STOPCheck out the last post from @hivebuzz:
Congratulations, your post has been upvoted by @dsc-r2cornell, which is the curating account for @R2cornell's Discord Community. Enhorabuena, su "post" ha sido "up-voted" por @dsc-r2cornell, que es la "cuenta curating" de la Comunidad de la Discordia de @R2cornell.