Que es un Triangulo Simétrico Alcista :
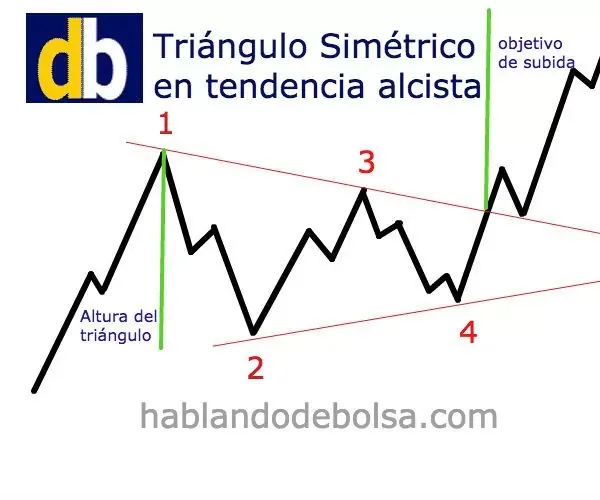
El triángulo simétrico es una formación chartista, cuyos máximos y mínimos van siendo menores y mayores respectivamente, de una forma equilibrada, formando un triángulo que ni es ascendente ni descendente. Este triángulo simétrico se puede presentar en cualquier tipo de tendencia y se debe de interpretar como de continuidad de la tendencia. En tendencias alcistas, los triángulos simétricos se corresponden con correcciones naturales de las alzas previas que tras realizar el triángulo continúan con su tendencia alcista.
Es lo que vemos en la gráfica y lo que vivimos en Bitcoin en los últimos días, hoy rompimos esta tendencia o figura chartista pero a la baja. Yo aun estoy alcista en cuanto a gráficos y lo que me indican las herramientas de Trading, ya más adelante les contaré que necesitamos saber si de verdad entramos en un cambio de tendencia, de alcista a bajista. Yo estoy más que seguro que aún le queda mucho terreno por subir al bitcoin y muchos meses por venir también este tipo de correcciones, son normales en los ciclos del Bitcoin hasta saludables. Para el mercado ya que no todo el tiempo debe subir y subir, todo el tiempo para mi es muy buena zona para ir comprando o acumulando más satoshis. A mi portafolio.
Triángulo Asimétrico de Tendencia Bajista :
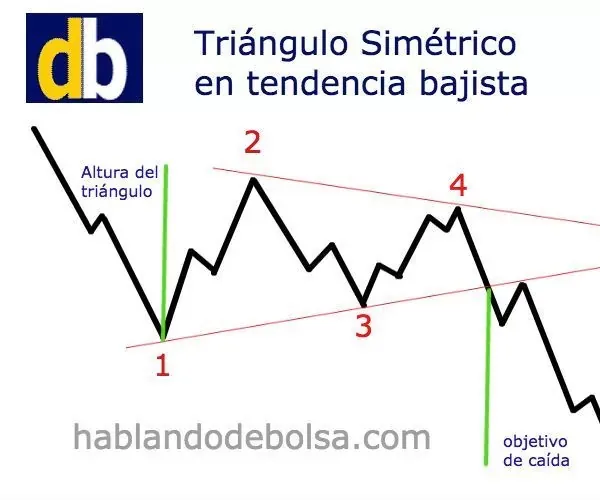
En este caso, el objetivo de caída de los precios es igual a la altura del triángulo a contar desde la ruptura de la línea de tendencia. En tendencias bajistas, si los precios van formando un triángulo simétrico pero el precio rompe por arriba se debe desconsiderar y no hacer ningún cálculo de precios objetivos ya que la formación habría fallado. No se olvide que el triángulo simétrico es una formación de continuidad y no cabe considerarla como de cambio de tendencia.
Actualmente el bitcoin hizo rotura de este triángulo a la baja y dándonos señales de cambio de tendencia, para mi esto es normal en unos días podemos ver un gran repunte en el precio y continuar. En nuestro bull run però si vemos que baja hasta los 24 mil dólares y baja más de la E. M. A partir de 22 Semanas si les diría que estaríamos ya en un canal bajista y cambio de tendencia también debemos esperar. A la vela mensual como termine el mes yo sigo muy alcista aun y sigo acumulando mis satoshis. No vendo solo lo acumulado para mi retiro.
What is a Symmetrical Bullish Triangle :
The symmetrical triangle is a chartist formation, whose maximums and minimums are becoming lower and higher respectively, in a balanced way, forming a triangle that is neither ascending nor descending. This symmetrical triangle can occur in any type of trend and should be interpreted as trend continuity. In uptrends, symmetrical triangles correspond to natural corrections of previous uptrends which, after forming the triangle, continue their uptrend.
This is what we see in the chart and what we have seen in Bitcoin in the last few days, today we broke this trend or chartist figure but to the downside. I am still bullish in terms of charts and what the trading tools tell me, and later I will tell you that we need to know if we really enter a change of trend, from bullish to bearish. I am more than sure that bitcoin still has a lot of ground to climb and many months to come also this kind of corrections are normal in bitcoin cycles until healthy. For the market as it should not all the time go up and up, all the time for me is a very good area to go buying or accumulating more satoshis. To my portfolio.
Bearish Asymmetric Triangle:
In this case, the downward price target is equal to the height of the triangle counting from the break of the trend line. In downtrends, if prices are forming a symmetrical triangle but the price breaks above it should be disregarded and no price target calculation should be made as the formation would have failed. Do not forget that the symmetrical triangle is a continuation formation and should not be considered as a trend reversal.
Currently the bitcoin broke out of this triangle to the downside and giving us signs of trend change, for me this is normal. In a few days we can see a big rally in the price and continue. In our bull run but if we see that it goes down to 24 thousand dollars and lower than the E. M. From 22 Weeks if I would say that we would already be in a bearish channel and trend change should also wait. On the monthly candle as I finish the month I am still very bullish and I continue to accumulate my satoshis. I do not sell only the accumulated for my retirement.
Posted Using LeoFinance Beta
Congratulations @elchicocripto! You have completed the following achievement on the Hive blockchain and have been rewarded with new badge(s) :
You can view your badges on your board and compare yourself to others in the Ranking
If you no longer want to receive notifications, reply to this comment with the word
STOPCongratulations, your post has been upvoted by @dsc-r2cornell, which is the curating account for @R2cornell's Discord Community. Enhorabuena, su "post" ha sido "up-voted" por @dsc-r2cornell, que es la "cuenta curating" de la Comunidad de la Discordia de @R2cornell.