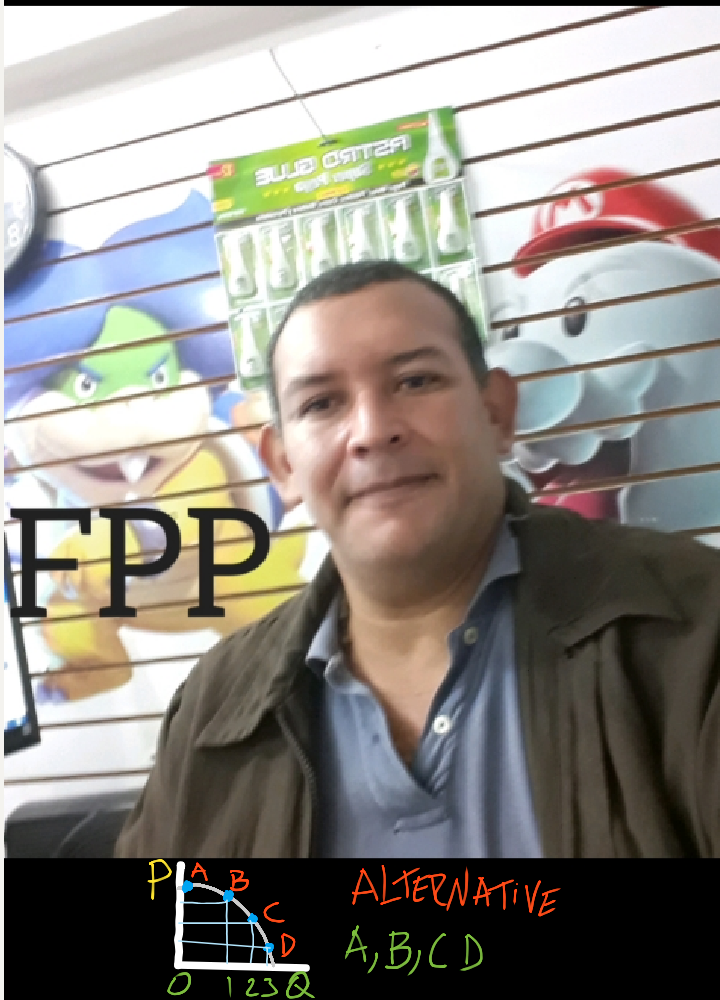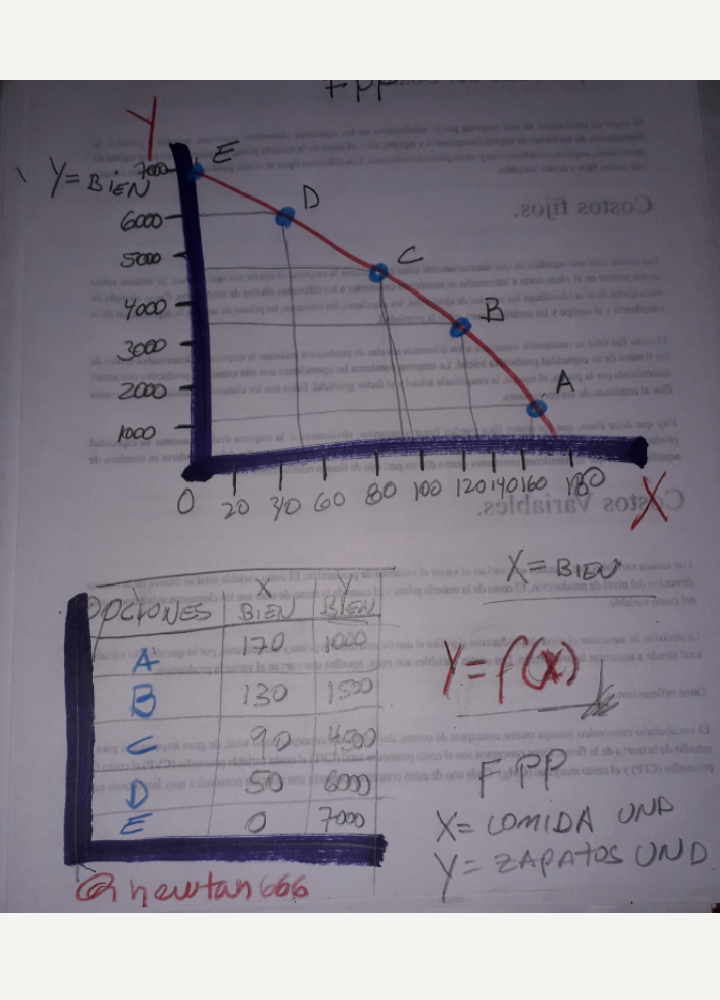
Continuing in the field of Economics we have the production possibilities border curve, where it shows us as a means of knowing how to produce, for whom to produce, in the sense of knowing the best option to produce goods and services that quantity satisfies the need for an economy, it focuses on the capacity of its cost and available resources, since a large number of food units can be produced depending on the production of footwear or clothing, it will be analyzed what the most latent need will be and that this model allows us to make a better decision. Already knowing these aspects clearly, you should know what an opportunity cost is, which this refers to when we renounce a good or service that satisfies another that fulfills the same function, in order to optimize our resource, an example daily is the buy unit of or half a carton of egg that meets the same purpose.
Options and alternative.
Graphical and mathematical analysis

In this graph we observe a representation of the production possibilities frontier, where its different options are shown as an alternative to produce (y) good and service based on (x) good and service, to determine the best option to produce the good and service that satisfies as much as possible the need of society in an economy in a given time, in order to project the possible alternative that an economic model can use knowing what to produce, how to produce and for whom to produce, which is subject to an opportunity cost based on two goods or services to make a better decision. In an economy that has thousands of products, the alternatives to produce one or the other good and how much of each one are very great.

"comrade" and "economics" dont fit in the same sentence hahah, but interesting read
Thanks but I already corrected it: it's from friends
@tipu curate