Price Action Swing Oscillator :
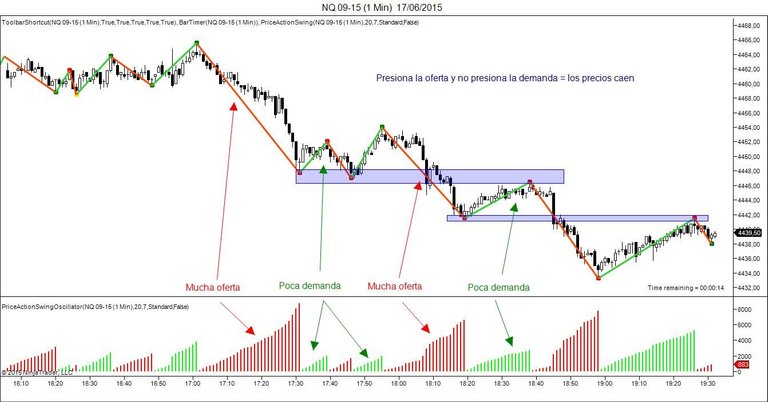
El Price Action Swing Oscillator : es un indicador creado por Dorsch en que consiste en sumar el volumen de cada vela dentro de una misma onda para poder analizar la oferta y la demanda en su conjunto. De un simple vistazo podemos ver que tramo tiene más/menos fuerza de acuerdo al volumen, es decir, método Wyckoff puro y duro.
El indicador viene a explicar la teoría del esfuerzo y el resultado. Cuando hay demanda y no hay oferta (miramos el oscilador) estamos alcistas y cuando no hay demanda y sí oferta, pasamos a ser bajistas y los precios deben caer.
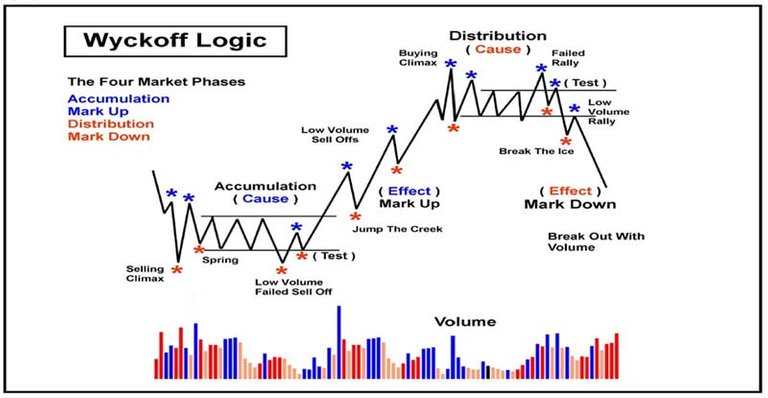
La Ley De Wyckoff : es una de las más confiables y predecibles en el trading, ya que como nos muestra en la gráfica es el volumen de compra en el mercado que estemos operando. Nos puede indicar claramente si nos vamos al alza o simplemente a la baja por. El volumen. De compra nos indica en verde es que hay mucho volumen al alza y en rojo es que hay poco volumen y nos vamos a la baja por eso es que se le llama ley de esfuerzo y volumen, como el mercado es muy volátil es muy común ver grandes cantidades de volumen en el mercado y el esfuerzo. Para irnos a una tendencia alcista o bajista, debemos estar atentos a todas estas señales del mercado. Para obtener grandes beneficios otra recomendación es no operar encontrá del mercado nunca. Un ejemplo claro este año no hacer short o cortos al bitcoin, ya que vamos a salir quemados o arruinados en un corto tiempo. Yo sigo alcista y no operó en corto sino en long o en largo.
En esta gráfica se puede ver mucho mejor el volumen y el esfuerzo y explica mucho mejor, todo lo antes escrito es un claro ejemplo de lo que estamos viviendo en el cripto mercado en estos momentos.
English :

Price Action Swing Oscillator :
The Price Action Swing Oscillator : is an indicator created by Dorsch which consists of adding the volume of each candle within the same wave in order to analyse the supply and demand as a whole. At a glance we can see which leg has more/less strength according to the volume, that is to say, pure and simple Wyckoff method.
The indicator comes to explain the theory of effort and result. When there is demand and there is no supply (we look at the oscillator) we are bullish and when there is no demand and there is supply, we are bearish and prices should fall.
Wyckoff's Law: is one of the most reliable and predictable in trading, because as shown in the graph is the volume of buying in the market we are trading. It can clearly indicate if we are going up or just down. The volume. Of purchase indicates to us in green is that there is much volume to the rise and in red is that there is little volume and we go to the fall for that reason is that it is called law of effort and volume, as the market is very volatile is very common to see great amounts of volume in the market and the effort. To go to an uptrend or downtrend, we must be attentive to all these market signals. To make big profits another recommendation is to never trade against the market. A clear example this year is not to short bitcoin, as we are going to get burned or ruined in a short time. I am still bullish and do not trade short but long or long.

In this graph you can see much better the volume and the effort and explain much better, everything written above is a clear example of what we are experiencing in the crypto market right now.
Translated with www.DeepL.com/Translator (free version)