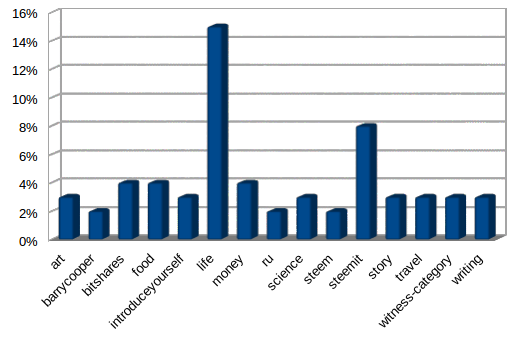
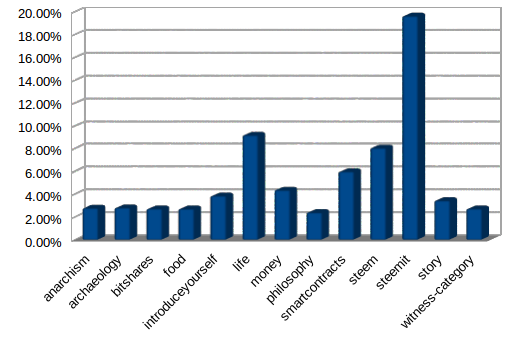
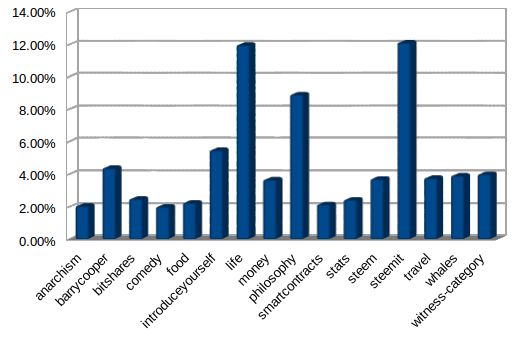
This is a snapshot of data taken from the current top 100 trending posts. It is intended to be used as a quick reference for content creators to roughly gauge what is currently trending the highest among readers.
MOST FREQUENTLY USED TAGS
HIGHEST DOLLAR VALUE
MOST VOTER ACTIVITY
MOST DISCUSSION GENERATED
This data is NOT a comprehensive analysis of all post data on Steemit.
It covers approximately the last 24 hours.
Upvote if it's useful.


Were the Steemit tags left out intentionally?
If you mean the actual Steemit category, it's there on all charts. If you mean other categories not displayed, I left them off if they were below 2% in their respective categories. This was intentional so it wouldn't clutter up the chart unnecessarily. I was going for clarity of information rather than quantity.
http://steemanalytics.it/
It appears to show different data here.... Maybe I am looking at it wrong
It looks like the same data but on a longer time frame and it appears to include all categories, even the low percentage ones. My focus is on what is trending the highest as of today. But I definitely like that you pointed out that website. I hadn't seen it before. Thank you.
Agreed, I like yours too, and I also hadn't seen it! Steeming through our educations here.