A Visual Canvas for Data-Driven Ideation Workshops
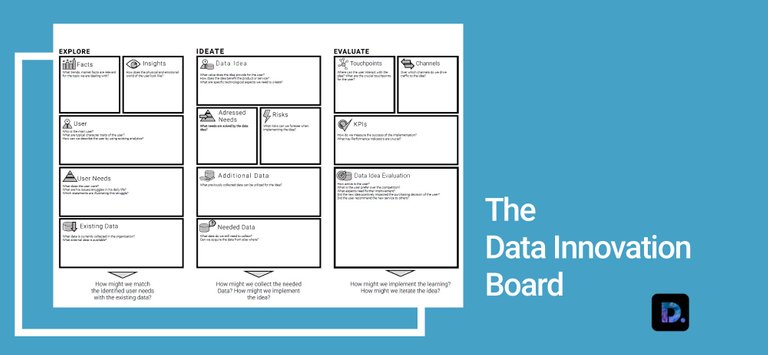
In the last post, I wrote about what Data Thinking in my opinion is. While working on the the theory, I developed a visual collaboration tool — the Data Innovation Board. In the following paragraphs I am going to present the individual building blocks and the basic functionality of the canvas.

Data Innovation Board: A little bit of theory…
In the classic design thinking process, we have five distinct phases. However, there are tools like the Digital Innovation Board by Dark Horse Innovation that summarize these five phases of convergent and divergent thinking into three distinct sections. In order to reduce the initial complexity, the DIB follows the Digital Innovation Playbook [3] by Dark Horse and follows the same structue: Explore, Ideate, and Evaluate.
It follows lean principles [4, 5] and conceptually focuses on the iterative circle of Build, Measure, and Learn by Eric Ries. This approach is closer to what is tried to achieve with the DIB, since a new idea is supposed to be developed and tested.
Data Innovation Board — But Why?
Design Thinking is a method that facilitates user-driven innovation processes [2, 6]. However, data innovation has its own particular challenges. Bhargava and D’Ignazio [1] claimed that there is a “lack of consistent and appropriate approaches for helping novices learn to ’speak data’”.
The Data Innovation Board is a visual canvas helping teams to monitor their collaboration in terms of ideation and prototyping over a longer period of time. Hence, users of the board are able to iterate over every block and come back to it to ask whether previous assumptions are still relevant at the stage of the development. Aspects involved in the single blocks can then be changed and updated based on new insights.
In order to create a framework that can be used to sharpen a more data-oriented view on new ideas, the prerequisites the tool are the adherence and support of the main design principles. As such the tool needs to be user-centric, enable prototyping and still be suitable for several of iterations during the development period. In addition to this, the new concept of data needs to be included.
Data Innovation Board — How does it work?
The blocks are allocated in the three process steps: Explore, Ideate, and Evaluate. At each of the three steps, linking questions connect the three different process steps. Similar to the Business Model Canvas [30], each building block has guiding questions leading the user of the tool through the board. The DIB also follows this method when asking data related questions.
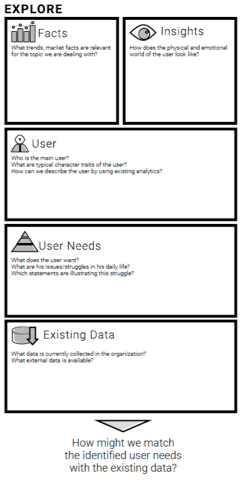
In the Explore area, the primary objective is to increase the understanding of the situation. In this section the team is supposed to apply divergent thinking. This means the user is explored as broad as possible in this step. Additionally, it is required to understand the data that exists within the organization, or more specifically, what data the organization currently owns or stores about the user, its behavior and other valuable data sources. These are described in the Existing Data blbock. The link question that leads over to the ideation period is How might we solve the user needs with the existing data we currently have?.

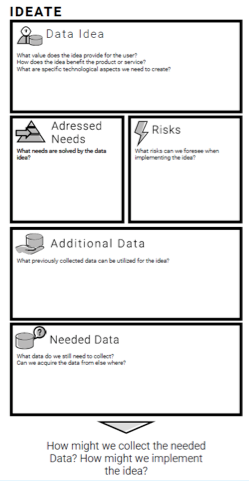
The question is the introduction to the brainstorming period. In the Ideate area describe the Data Idea in more detail. The team is following a convergent thought process. It summarizes the user needs that are addressed, potential risks as well as the data that is used and that still needs to be added additionally.
Additional data can be acquired from an external source, like e.g. open data portals or which needs to be collected in addition internally. The link questions that need an answer before users of the DIB can proceed are How might we collect the additional data? and How are we planning on implementing the prototype?.

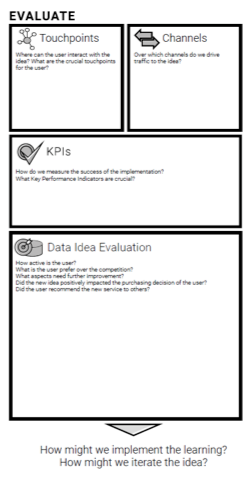
In the third stage, the Evaluate period, the main objectives are to measure the success of the idea and collect the learning for later iterations. As such, Touchpoints enable the data idea. This is where the user is getting in contact with the new idea to receive the value. However, in most of the cases the idea needs traffic. Hence, channels should summarize how the collaborating team is planning on promoting the new idea and from where they want to acquire traffic. All observations about the performance, new learning about the user interaction and general experiences with the newly implemented data idea can be collected in the evaluation period. Those qualitative learning are partly using the KPIs that measure the general performance of the data idea.
The link questions at this stage, initializing the new iteration, are How might we implement the learning? and How might we iterate the data idea?.

Want to learn more about Data Thinking?
If you are interested in learning more about the method, feel free to follow me here or on my other channels, or say hi in the comments. Moreover, I am happy to answer any questions regarding Data Thinking. Please leave a comment with your thoughts and ideas.
My series of posts is about making you think a little deeper about every day concepts. I look forward to having you follow along and reading what you throw at me. Peace!
Website: Dlighted
Linkedin: D.lighted
Twitter: @Dlighted_de
Instagram: @tizian_kronsbein
YouTube: Dlighted
References
[1] Bhargava, R., and C. D’Ignazio, “Designing Tools and Activities for Data Literacy Learners”, pp. 5.
[2]Brown, T., “Design Thinking”, Harvard Business Review, 2008. https://hbr.org/2008/06/design-thinking
[3] Dark Horse, Digital Innovation Playbook: Das unverzichtbare Arbeitsbuch für Gründer, Macher und Manager., Murmann Publishers, Hamburg, 2016.
[4]Müller, R.M., and K. Thoring, “Design Thinking vs. Lean Startup: A Comparison of two User-Driven Innovation Strategies”, Proceedings of the DMI 2012 International Research Conference: Leading Innovation through Design, Design Management Institute (2012), 151–161.
[5]Ries, E., The lean startup: How today’s entrepreneurs use continuous innovation to create radically successful businesses, Crown Books, 2011.
[6]Thoring, K., and R.M. Müller, “Understanding the creative mechanisms of design thinking: an evolutionary approach”, Procedings of the Second Conference on Creativity and Innovation in Design, TU Delft/IASDR (2011), 137–147.
Hi! I am a robot. I just upvoted you! I found similar content that readers might be interested in:
https://medium.com/d-lighted/the-data-innovation-board-44b9cc35e0ca
Congratulations @tkronsbein! You received a personal award!
You can view your badges on your Steem Board and compare to others on the Steem Ranking
Vote for @Steemitboard as a witness to get one more award and increased upvotes!