
 Daily mail Picture of sisters that had Kids of mixed race,
phenotipically seen as of different race by most
Race

A position shared by most geneticists is that the category known as race is not specially useful.[1] Still there are advantages to the self identification of phenotipic characteristics in the medical field.[2]
Such categories are arbitrary, and despite their usefulness -Which can be traced at not more than 3-400 generations[2],[3]- they are not a particularly meaningful way of dividing human genetic diversity. The idea of having clear-cut sets would be to identify the number of populations where the individuals are homotypic, this means of a single type.
The modern concepts of race come to us from the Victorian era, when essentialism was rampant.[4] A more recent equivalent of this comes to us in the form of dividing human populations by their position in continental masses (Asian, African, European) to find correlations and compare social outcomes like income, health, criminality and I.Q.[5]
Such approach disregards the interactions of environment, biology and emerging properties like social, economic and political changes.
Cline

The discontinuous perception of genetic variation among individuals across the land of the world has suggested the existence of >350 different genetic microsatellites. This summed to the phenotypic variation could suggest the existence of 350 Human races in the world, 250 of which reside in Africa alone.[6]
What most people consider "race" is a social construct, literally skin deep. This is, the ones used in every day are marginally related to what geneticists mean by race. These categories are assigned by identification rather than by ancestry. Haplogroups are a combination of haplotypes, which is a form of identification of distinct subgroups that can't easily be traced by just observation and shares an overlap with the everyday concept of race. They share a patrilineal or maternal common ancestor.[7]
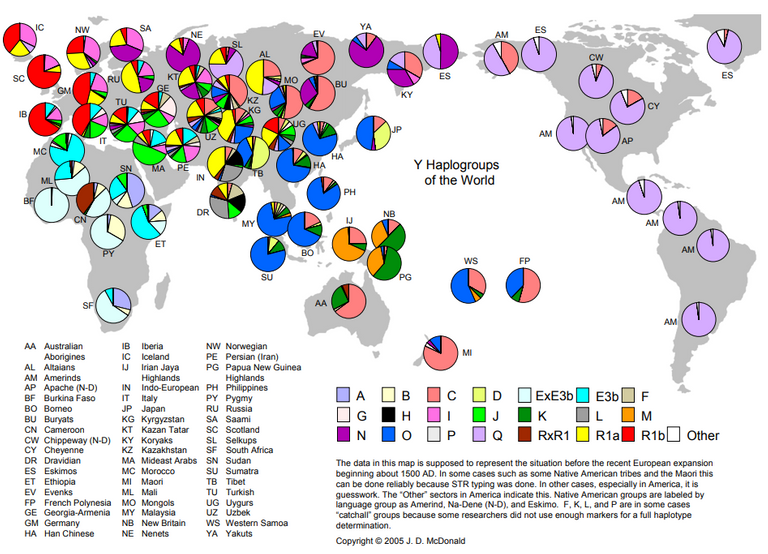
 In this Haplotype map of Y chromosome one can trace for instance the
A deme is a distinctive group between a species where reproduction is still possible but each group is subjected to different selection factors - eg. birds with different mating calls- If there's a continuous variation across geography in the two extremes of the phenotypes, then this is called a cline.[8] A cline is a subgroup of deme where there's a gradual transition of the characteristics without discrete differentiation (example: hair color)
The description of what is a species, subspecies, cline, deme is mathematical.[9] We use the Population's fixation index (FST), developed by Sewall Wright. Is a way of describing populations substructure, to see if the group is genetically homogenous by examaning the variance in allele frequencies between population and on the probability of identity by descent.
Which translates in practical genetic data to 


The FST of modern humans is around 12% based on the International HapMap project's data. this means that 88% of all variation among humans is shared by all groups. The initially proposed cut for when a population can be classified as valid if the FST for the subspecies is >25%. This can be interpreted that the kinship as seen by such measure between two people of the same subpopulation is slightly higher than between two siblings of mixed populations parents 0.125-0.109 respectively. This illustrates the extreme of the subspecies classification of humans.[10]
In contrast about 1/3 of the time a person is more phenotypically similar to someone of a different population that to a member of the same population[11]
Any conversation must always relatively below the subspecies term. When there can be a spread in FST such that nonrelated individuals have a kinship to grandparent and child or two mixed race siblings, this is a testament of how most genetic variation is bigger among individuals than due to race.[12]
One can find that even the most white isolated populations in America have at least 3% african ancestry while Africanamericans have 20% white ancestry.[13]
We can have millions of races or one. As anything bellow subspecies is an arbitrary statistical correlation. We can talk of clines or demes and is important to remember that this classification is put there by us. It wasn't already there, so to speak. Like dividing world history in eras, making a continuum discrete to make it simpler to grasp.
Are there good ways to put the limits to such arbitrary divisions?
For this one can use the principal component analysis, on the eigenvector one plots a wide combination of genetic markers from non-coding regions and they have not been selected for.[14] This would mean that we are most likely observing the natural genetic drift of a population not due to environmental and sexual selection.
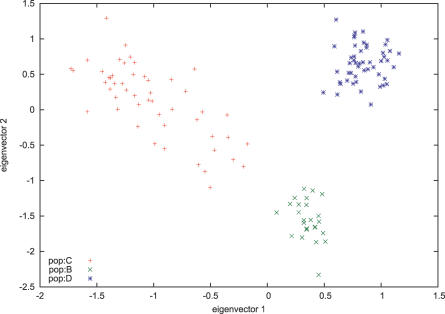
 Admixture of two populations, where population C is a recent derivation of B and D, with a large dispersion.
Consistent with the Thai, Chinese and Japanese populations in the Haplotype Map [15]
Each point in the graph represents a group of individuals drawn from a different population. If a population is a distinctive deme, you would expect that by sampling across all intermediary geographical positions between two distant places you will find genetic discontinuity.[16]
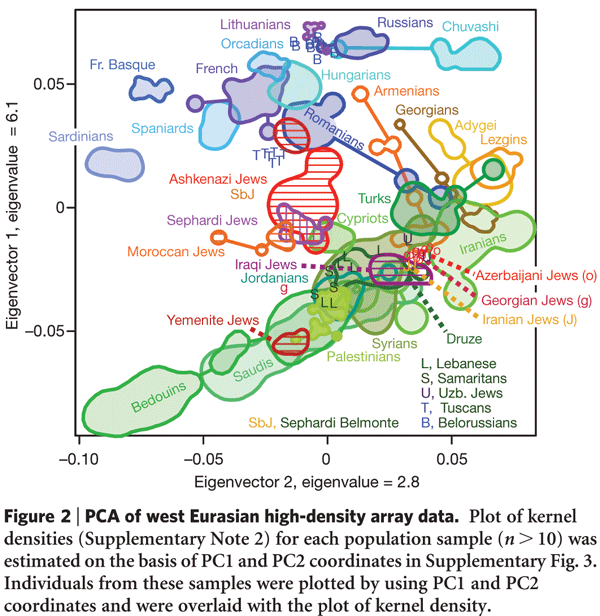
In the case of humans what you find is that the more distant they are, the less related. Which suggests humans are a cline and genetic exchange of material flows continuously. This cline distribution can be seen across the world with regional discontinuities marked purely by geographic isolation and even at the local level there's variation -particularly in africa[6]- if one wants to draw a hard discrete differentiation there are not more than 1-2 groups. Otherwise one would have to accept hundreds or even thousands of races (e.g., at least 20 distinctive races of Jewish people that would overlap with groups that don't self-identify as Jewish)[17]
If we instead go by inferred populations we could divide the sets at k=2, 3,4...350; being 4 the commonly used division in Europeans, African, Amerindian, and Eastasians. Again, this is arbitrary, mostly due to social construction and reflects a particular perspective on a cline.
One can use a division to show a deme. This doesn't reflect anything about the populations but about what we are trying to say about our particular division. It can be useful but always remembering is arbitrary.
I'm planning on addressing IQ and Race in a future post. It's a subject full of thorns that most don't find any usefulness in yet is an interesting application of how good statistics of a superficially treated subject can be damaging.

Also T=-7 days for my departure to the Steemstem Meet up (With scales it will take me around 15 hours by flight plus 7 hours by train, a slightly long trip). Super excited!

REFERENCES

&space;})
Being A SteemStem Member
I love this your analysis of population genetics. Even evolution supports the fact that we all share a common descent. The concept of race is too artificial to be used for division. It is all in our minds. At molecular level, we are all virtually the same except for few environmentally modified genes.
I love reading your work @ertwro. I like the way you do your analysis. Unfortunately, I do not know much about PCA, but I am going to make a point of duty to read up.
Thanks for this lovely post
Depending on your background I can help you gain the intuition on that particular form of dimensional reduction, if you have a good background in linear algebra it should be easier, if not I can also help you with that. Let me know what's your current knowledge and I'll point you to a resource that will take no more than 5 minutes.
Thanks a lot for the help offer. I have basic knowledge of regression and correlation analysis and a fuzzy knowledge of PCA. I think the application is what I cant grab yet
One must remember is not properly a statistical analysis tool but a data visualization tool. Is biased. (although you can do further PC regression and even partial least squares regressions, but that's just for completition) In this case, since the information I wanted to represent and the point I try to make, a cline and how is a linear continuum of change across geography. PCA's represent linearly changes in a continuum of a set, it sounds like dimensional reduction is a match made in heaven for us in this case.
If you want to represent a lot of information from several variables, with probable correlations analysis, in a single graph while conserving most of the variance of the data. The first advantage is you can represent it in two dimensions (draw it, I mean try to draw 7 variables and their axis), the second is that the clustering or redundancy hints at the information that was lost in the flattening or reduction of the dimensions.
Video on the intuition of PCA 1, 2
The two more common options are either PCA or Heatmaps with hierarchical clustering.
Article comparing their differences
Those clusters are methods to group the shared redundancies of the data of those variables. It saves a lot of computational and graphical costs instead of doing this:
ps: Sorry if you get lots of notifications on the edits. I'm doing this from a phone and I have OCD.
This is lovely. A lot of information at once. I will take my time to digest them in bits. thanks!
This is an exceptional piece of work, and very interesting to read. I'm looking forward to the next post on IQ distribution... The topic is rather hot, as it's an argument used by open racists from time to time - I'll appreciate a well-recherched scientific opinion on it.
Yeah, probably the main point to address is "The Bell Curve" by Herrnstein and Murray. While is relative to attack the unsupported assumptions the authors must make to deal with I.Q. Is a straw man of their research. When one can address the weakness of the math, instead of the determinism in the biology or the soundness of the psychology.
So if I understood you, it doesn't make any sense this cline nor even race categorization, why we still do use it. Apropos I wish you tons of fun in the Steemstem meet up!
Thanks, mate, wish you the best in Medellin and in soon in Switzerland you too! It's a shame or itineraries don't coincide, that would have been pretty cool.
Maybe the next time. I hope we both can make it again.
Dude really interesting!, I anxious to read how the IQ and this arbitrary races are related, maybe that could make clear, why these arbitrary divisions were made. Thanks
That's precisely the point. What if we change K, how does this impact the data? Also it is interesting seeing how things like the Flynn effect are interpreted.
fact of the matter is we all have red blood running through or veins, color of our skin tone should not be the basis upon which we are judged.
Completely true.
Such a nice article! As a newcomer here, those are the kind of articles I was hoping to see.
Good read! Keep it up @ertwro
I keep on keeping it up.
This is cool man I'd love to read more of this🙆
Sure, I'll keep it coming. You will read it.
Alright brov.. Keep it up
Great work very educative and informing thanks for the post now i know more
You are welcome.
race is not nore. As we all know we are brothers and sisters from one parent from so many years ago. God created his first man and women and have all types of mud. As we belive all are equal and have equal rights its god's choice and we dont be panic about it.
Thanks again Thanks @ertwro for this news articles but please real my virtue carefully....
Ok, you are welcome. Although am not sure what you mean by "real my virtue".
awesome article. Indeed, a very informative one. Good job @ertwro
I'll keep being informative, I guess.
Awesome post mate! Really well written and super interesting :)