Ah, summer, our relationship is certainly a rocky one.
I live in central Texas, so summer comes with quite the set of mixed emotions for me. Growing up in Colorado, I grew used to a temperate, dry climate. Central Texas is quite the opposite. Sure, we might get a few days of ice on the roads in January, but I have yet to see any real snow in my six years here. Once we hit April, highs climb into the 80s. May usually sees upper 90s; and once June hits, triple digits are the norm. This lasts until September, and often into October when the temperature begins creeping back down into a more reasonable area. And the humidity. Oh, the humidity. I could die sometimes. I miss my state (going home 2018-2019), but I sure do love a good float down the river while I drink beer, smoke some Cannabis, and trade coin.
You may be wondering what connection my anecdote has with Bitcoin. Very little, in fact. Sometimes I just like to hear myself talk, but there is a small thread of reason in my rambling. A method to the madness, so to speak. I want to talk about what Bitcoin is doing this summer, since it doesn't have the luxury of hopping in a tube and floating down the river with me.
Anybody with the slightest experience in Bitcoin investing knows about the “Bitcoin Roller Coaster.” Digital assets are some of the most volatile investment options money can buy. What I want to show you is why, 1) this is no cause for concern for long-term investors, and 2) this is extremely good for people who wish to compound their investments with some informed decision to buy and sell the swings, as well as share my view on where Bitcoin is headed over the summer. Is that a run-on? I suck at writing, but I digress.
Bitcoin.
Let me introduce you to my friends, Bully, the bull, and Beary, the bear. They have creative names, I know. Say hi.

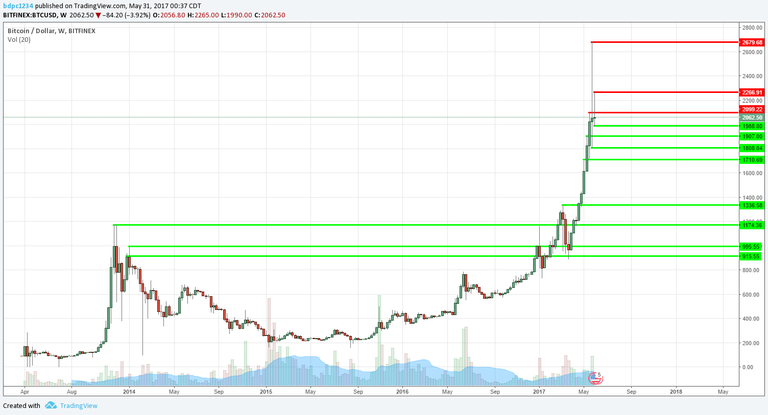
Let us begin our analysis by looking at the weekly chart for Bitcoin, on the Bitfinex exchange. Step one would be identifying major areas of price support and resistance.

Key support areas are found at 1988, 1907, and 1808. Oddly enough, (not out-of-the-ordinary at all, actually) these levels correspond with the rounder, psychological levels of 2k, 1900, and 1800. It would not be incorrect to view these levels as the true support levels, but I prefer a little more precision. Support tends to act in ranges, anyway. What we long-term bulls hope to see is the price to hold above 1988, so as to avoid the crash down to the next support level below. I however, find this extremely unlikely. Ruling out these important psychological levels, however, we see important support lines at 1336, 1174, (the all-time-high for many months) and finally, 995 (call it 1000). Bully will be working his large butt off to keep Bitcoin up, at these levels.
The large Dogi candle, found at the top of the chart, represents the huge volatility we experienced last week, and is a bearish sign, indicating market indecision, and a possible reversal. Bully took the market up to the new all-time-high of 2679 before Beary overpowered him, seized control, and clamped down on poor little Bitcoin with gnashing teeths, sending a shock wave through the market and beginning the correction.** Resistance to the north is found at 2099, 2266, and 2679 (ATH).** Bitcoin will have difficulty passing through these important levels, as Beary will be hot on his tail when he manages to escape from time to time. As of now, this gives us a trading range of 1988-2099. This is a short-term range, however. This chart can continue to provide a number of clues we have failed to touch on, so let's add a few more pieces.

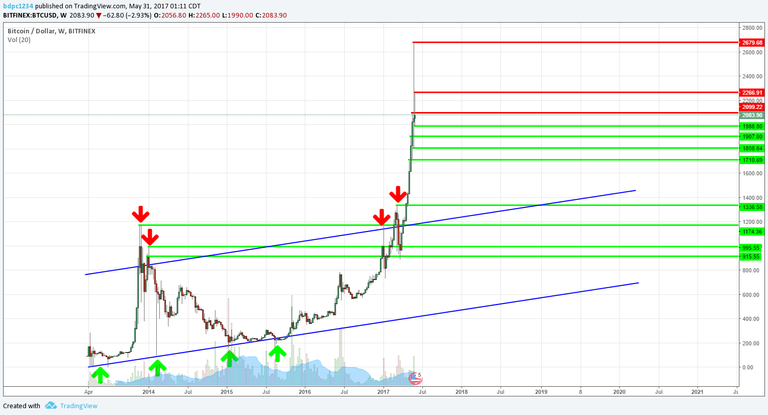
This trading channel (blue lines) represents a multi-year channel, beginning in 2012, and stretching into this year. To reiterate the importance of this channel, Bitcoin traded within this range for more than five years, before the huge breakout this year. Beary wants to see Bitcoin come back down to this range. Since this is obviously a confirmed breakout, (rising volumes, accompanied by a price spike) we can expect the upper bound of this previous channel to also act as support. Without knowing when (or if) Bitcoin will test this price area, calling the actual price trend support level is difficult, but we can take a range, and compare it with our other supports. We find this support area falling between 1174 and 1400.
Now I can hear everybody screaming, “But that is $700-$1000 less than the current price! There is no way it could fall like that!” Or maybe those are just the voices in my head again.
<author twitches, mumbling to himself>
How do we determine if the price will reach these very attractive levels? We have a number of tricks up our collective sleeve. Let's add in the Fibonacci retracement tool, and a little Elliott Wave Theory.

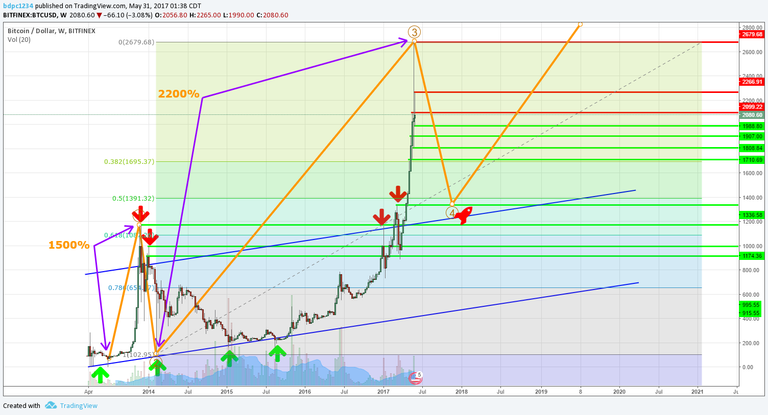
Now, we have ourselves a chart. I have measured the 2200% impulse wave three, with the fibonacci retracement, using the low after the Mt. Gox scandal in 2013, ($100) and the all-time-high of $2679. Just as a quick note, according to Elliott, the man who made Elliott Wave Theory, we can usually expect wave three to the longest of the five-wave pattern. Furthermore, in order to be drawing proper Elliott Waves, the corrective wave four may never enter the trading range of wave one (support level 1174).
Putting this all together, the weekly chart for Bitcoin is bullish long-term, but bearish in the intermediate. Wave four must correct the huge run we saw in wave three. Using the fib tool, we can see some potential, additional support levels, which, in order to use effectively, should be combined with other support areas. The most important of these fib levels is the .618. The explanation behind how the fib tool works is quite deep, and beyond the scope of this article, but it works like magic. We find the .618 retracement level very near the 1174 support, less than 100 points down at 1082. Since a drop to this level would negate our Elliott Wave analysis, we should also pay close attention to the .5 retracement level, as well, which corresponds very nicely with our 1336 support level, at 1391. Also worth noting, we have the fib tool showing possible support in the area of 1700, corresponding with another support level.
Ready for my prediction?
Bitcoin is going to get mauled this summer by a giant Grizzly Bear (Beary, that is), in the form of a series a panic sells, initiated by news of “The Flippening,” huge price gains in Ethereum (my next article will be on the intermediate and long-term outlook for this big player), and just plain old FUD (fear, uncertainty, and doubt). But fear not, my fellow Bitcoiners. Wave five will take us to new all time highs. I won't postulate on what they will be (since nobody really has much of an idea). Long-term buy and HODL investors, HODL!
Possible targets for a reversal (read: GREAT times to buy for HODL) are as follows:
1) Fib level .382/Support Level @ $1690-$1700
2) Fib level .5/Support Level @ $1336-$1391
3) Fib level .618/2013 All-Time-High @ $1082-$1174
It is going to a bit of a rough summer, guys, if my analysis is correct, but that will present us with fantastic deals on Bitcoin. I am often wrong, so take it with a pound of salt, and do your own due diligence. Never risk more money than you are willing to lose. This is my personal opinion, and should not be taken as financial advice, or investment advice. With that being said, don't miss out on what will be remembered as the biggest money revolution in history. If you found this article interesting, please follow me on Steemit, Facebook, Twitter, and Youtube, and consider donating. All these links can be found below. Enjoy your summer, ladies and gents, and thank you for taking the time to read and share this article.
Steemit:
https://steemit.com/@agoramillionaire
Facebook:
https://www.facebook.com/agoristmillionaire
Youtube
https://www.youtube.com/channel/UCu0F5JTz88zIsoVl--quUfg
Twitter
https://twitter.com/AgoristM
Please consider donating to support my work:
Bitcoin: 14cwVDTCZVffApGh1BHboUM3CuYC81q9hK
Ethereum: 0xf499da186bbd23209757e59acc383ccb413e81d9
Litecoin (preferred): LRmX7HaMCfCp4hyTXsXrsqfN1HK2JSzxY3
Dash: XyWaDM7hfcUpr1GNiXS4mEvRbmfnMTX8ep
Nicely done! My thoughts exactly. So you think ETH will rise to how much?
This analysis and article took me a solid three hours to finish. I expect I will need to invest a similar amount of time to give my opinion on Ethereum. Let it suffice to say, I would not be surprised to see it trading as high as $500-$800, but this is only conjecture. My next article will be on my projection for ETH this summer.
good read, and i agree people are going to pump and dump for ETH, but hey in my books all that means is that BTC will sky rocket back up like you said. GO BTC!
I think your prediciton is right, we will just have to wait n see. also Texas seems cool, id like to go one day, but maybe not when its that hot 100+ thats like 35-40 degrees C!
Congratulations @agoramillionaire! You have completed some achievement on Steemit and have been rewarded with new badge(s) :
Click on any badge to view your own Board of Honnor on SteemitBoard.
For more information about SteemitBoard, click here
If you no longer want to receive notifications, reply to this comment with the word
STOPIf you want to support the SteemitBoard project, your upvote for this notification is welcome!
Good points in this blog. I fully understand what you're talking about. The price of a coin should depend on the quality of the product, the team behind it, if proffesional investors believe in it, and a lot more facets. Besides coinmarketcap.com there is: https://www.coincheckup.com This site did all the research for you. It's truly amazing. Check: https://www.coincheckup.com/coins/Bitcoin#analysis To watch Bitcoin Investment research report.