Analysis Summary:
Hi Friends, welcome to this Quick analysis of Bitcoin.

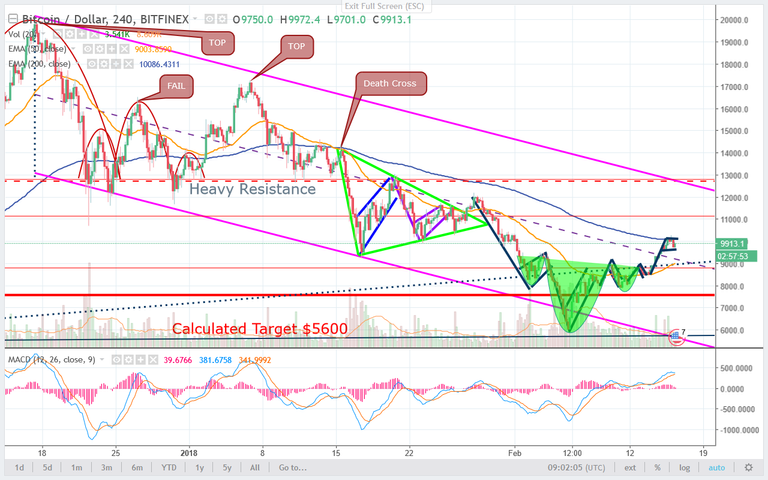
Looking at the 4 hour chart we can see that BTC swiftly moved and breached the triangle target that I gave in my last post around $10000. However since then BTC has somewhat being held around this level,
If you will look closely the target was near the EMA200 (blue) which tends to be a strong resistance in all the charts, but BTC so far is showing signs for an imminent breakout to this level by forming a bullish flag once again which I have drawn on the chart,
if this flag is broken on the upside a BTC can reach the top of downward pink channel around $12500 easily and a breakout above that will bring BTC out of the downward momentum it was experiencing for months now, A breakout to the top of this channel and the heavy resistance can provide some jet fuel to BTC and it can fly away quickly to the historical high levels again. MACD has dipped in recent hold but looking to recover and volume still looks supportive fall a bullish outcome.
But I would suggest to keep the mind on basics and trade a pattern only when the breakout has taken place, BTC now has many strong supports in waiting if it falls further, but EMA50 (orange) which BTC has defined as a support now is a crucial level and a fall below that which is very unlikely will negate this bullish flag so wait for the breakout to happen before setting targets.
That will be all for now, I will keep you guys Posted in the as the chart develops further.
Till then Goodbye and Best of Luck to You People.

https://steemit.com/esteem/@sayfulbahri/history-of-american-dollar-currency-9-141bdaa3dfbad
Follow and vote
Thanks for the analysis. I really hope that the market can turn bullish for everyone.