In this short article I wish to outline some of the technical analysis that I conducted for myself during the past year or so on the price of Bitcoin in USD. My main guideline for technical analysis is the Elliott Wave Theory that helps identify market sentiment. I will try to relate the analysis to the pattern that Clif High discusses (crocodile teeth) that is/was projected to manifest in the price of Bitcoin in USD.
Some of you may know Clif High's work, and some of you may not. Clif High is the person behind the so-called 'Asymmetric Linguistic Trends Analysis Intelligence' reports (also knows as web-bot reports). He uses language that circulates on the internet as an input to his model in order to attempt to make forecasts about future events. For more on his work, please visit his website www.halfpasthuman.com.
One of the main guidelines in the Elliott Wave Principle is that a market moves five waves within a main trend and three waves within a countertrend. Because I consider the Elliott Wave Principle a reliable tool, I use this guideline and so far it has served me well projecting the price of Bitcoin in USD and holding my Bitcoin during a sharp selloff. You see, these sharp selloffs are neccessary to throw some market participants off the Bull's back so that the trend can continue. Up to now it seems we have seen several sharp A-B-C zig zags during this bull trend, and those A-B-C zig zags look very much to be forming the larger 'crocodile teeth' fractal that Clif High is talking about. For those that do not know the term 'fractal': This stands for a picture of a market pattern at any given time on any given scale. I.e., markets move in waves and the patterns repeat and these patterns are called 'fractals'. For instance, you can see an A-B-C correction that takes 24 hours to complete or an A-B-C correction that takes 24 days to complete.
Now let me continue to the first fractal of an A-B-C correction in Bitcoin that started around the 18th of June in 2016. Note that Clif High predicted (based on his interpretation of the data) that the price of Bitcoin would receive a boost in price due to Chinese buying around the beginning of June (It turned out to be late May instead, but close enough I would say!). Of course you can argue whether or not Chinese buying was really the driving factor, but at the time the 'cause' of the price rise seemed to be widely contributed to Chinese buying.
In any case, please consider the chart below.
(daily chart)
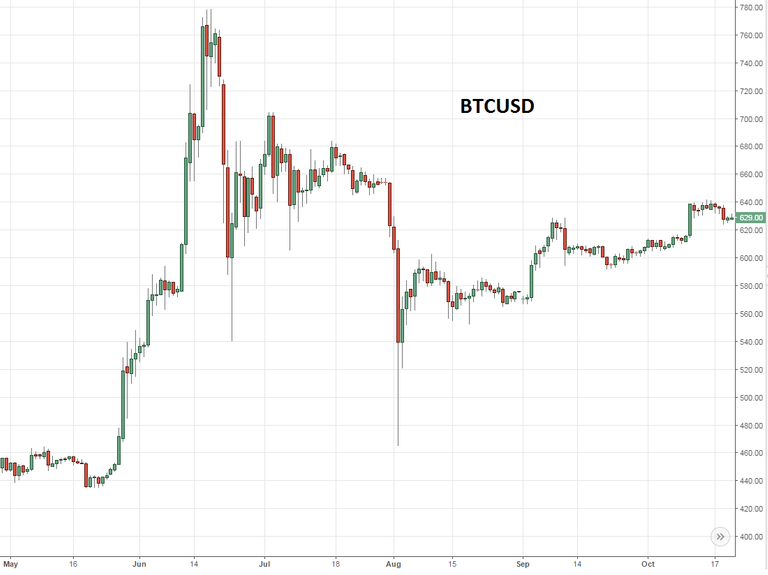
This is a picture of the pattern (fractal) of the explosive rally in Bitcoin last year that started at the end of May and ended with a sharp selloff before stabilizing and resuming its bull trend. This is the pattern that Clif High refers to (or his data) as 'crocodile teeth'. To me, it is an A-B-C correction.
Please consider the chart below in which I try to visualize this more clearly. Note the chart is a daily chart and so therefore each candle represents one day of trading.
(daily chart)
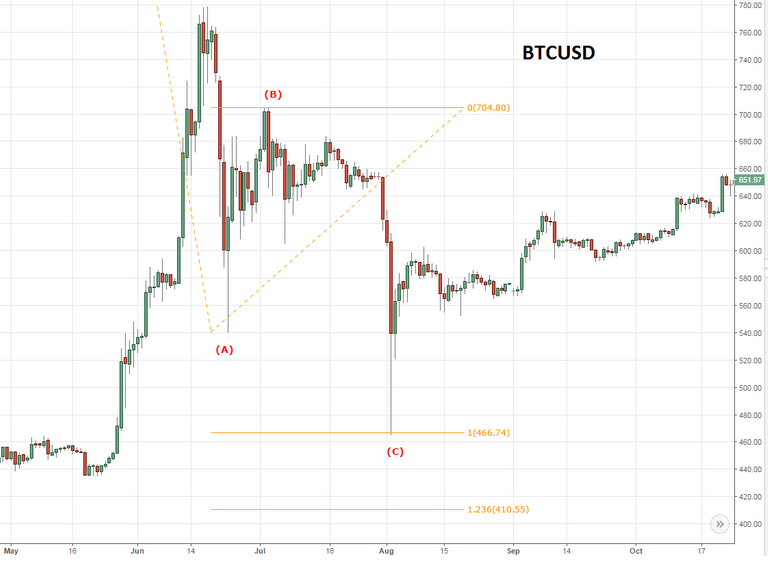
You see, it is quite common for an A-B-C correction to show equality between the A-wave and the C-wave, which is quite clearly the case here. Here we have our three wave correction in place before resumption of the main trend.
Now consider the same pattern repeated at the beginning of this year, now on a 4-hourly chart (where each candle represents 4 hours of trading).
(4-hourly chart)
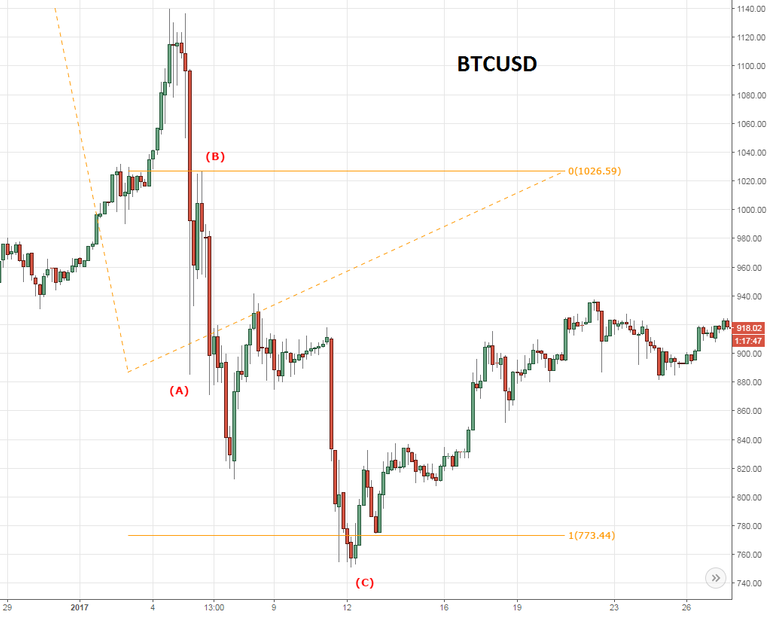
Again you can see the sharp selloff where the C-wave is approximately equal to the A-wave.
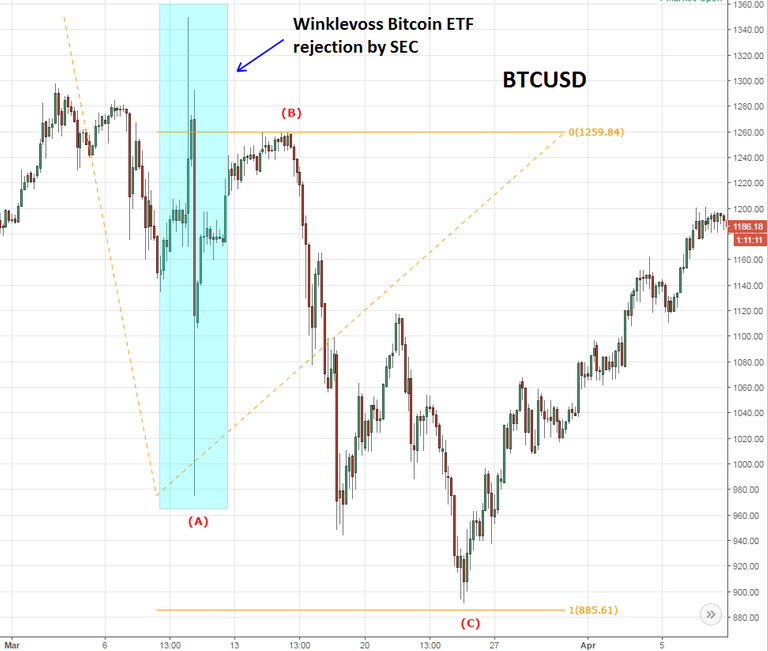
Here under, please consider the last two 'crocodile teeth' patterns, one of which is the most recent crypto bloodbath of more or less two weeks ago (started on 25th of May).
(4-hourly chart)
(hourly chart)
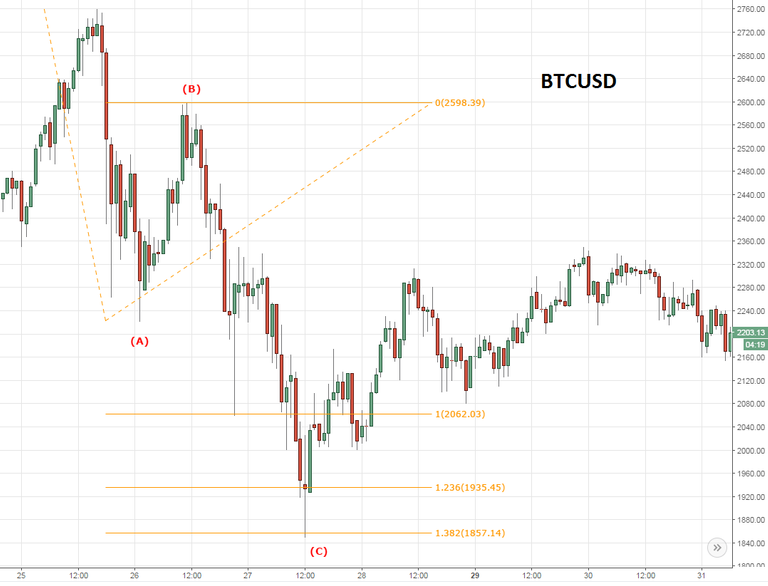
The most recent selloff was just another buying opportunity in my opinion. Though the pattern did not exhibit precise equality between the A-wave and the C-wave, it did reach the 1.382 extension to the tick and bounced nicely. This was suggestive of corrective price action. Though at this point I did not buy Bitcoin, but bought Ethereum instead as I believe it to have more growth potential.
Of course this article would not be complete without the bird's-eye view:
(daily chart)
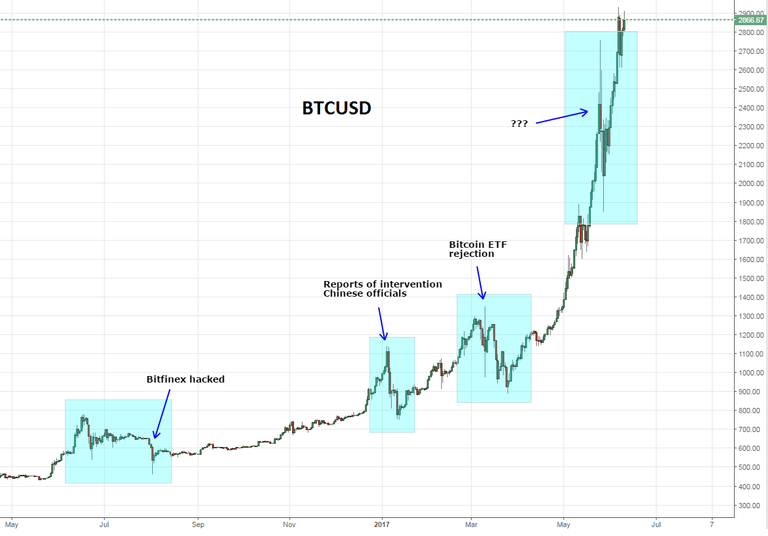
And thus we have the 'crocodile teeth' pattern.
I hope you enjoyed reading this article and that you found it informative. Please let me know in the comments.
STEEM on!
Congratulations @al3xander! You have completed some achievement on Steemit and have been rewarded with new badge(s) :
1 Year on Steemit
Click on any badge to view your own Board of Honor on SteemitBoard.
For more information about SteemitBoard, click here
If you no longer want to receive notifications, reply to this comment with the word
STOPCongratulations @al3xander! You received a personal award!
You can view your badges on your Steem Board and compare to others on the Steem Ranking
Do not miss the last post from @steemitboard:
Vote for @Steemitboard as a witness to get one more award and increased upvotes!