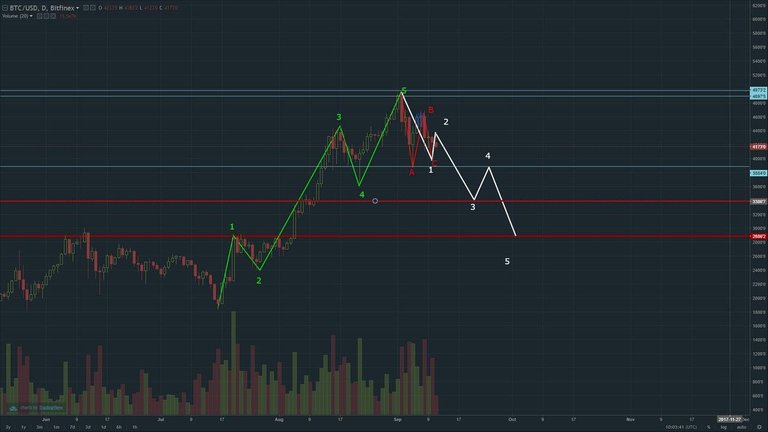
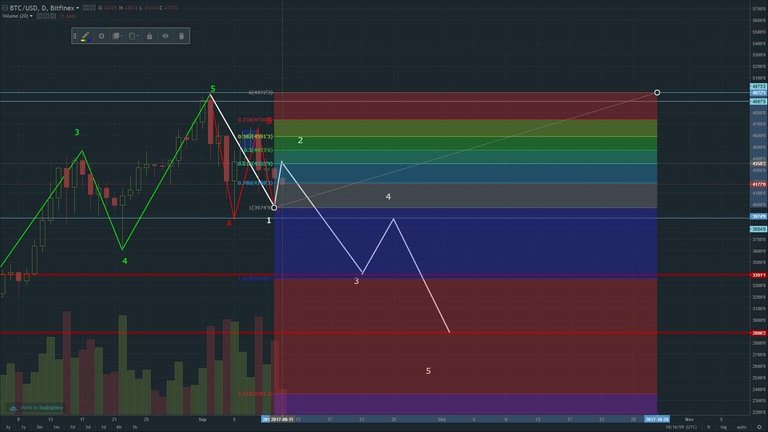
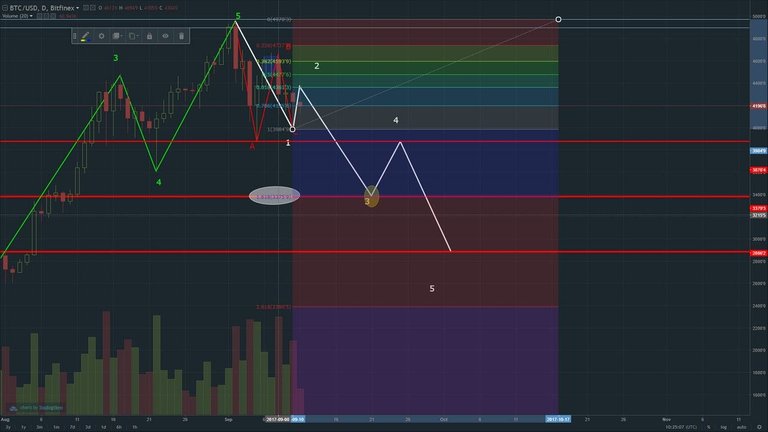
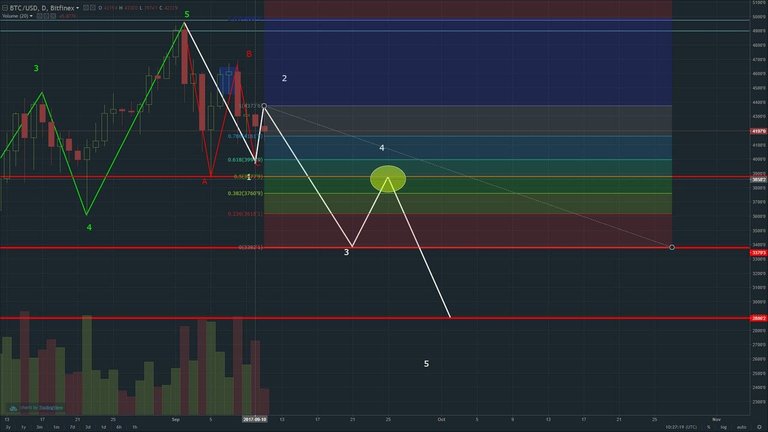
Just playing around with Fibo´s and the Elliott Wave Theory on the BTC Daily Chart.
I guess the following could happen:
Green Lines: 5 Waves (1,2,3,4,5)
Red Lines: 3 Waves (A,B,C)
White Lines: New 5 Waves for the future Price
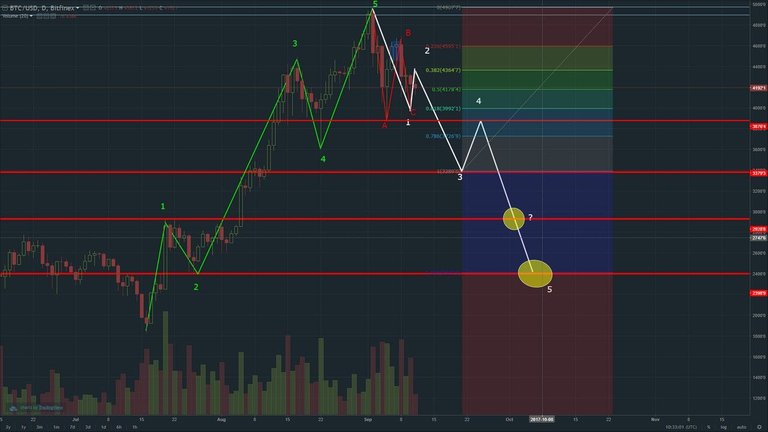
Thats just my theory...
What do you think?
Let me know.
Interesting! Thanks for sharing! Do you think it could possibly go below 3000? I think the price was a bit more stable today.
I think it is possible, for sure. This little up in Price, was a retest of the $4380 USD Resistance, i guess.
On the H1 Chart, it now looks like we get another M-Pattern and the Price is going to fall to the $4120 USD Mark again.
Then we will see, if it bounces back or we get a breaktrough.
Again, just my opinion ;-)
Thank you!!