Hello friend, thanks for the analysis. I learn a lot of these post, little by little starting in this world.
I'm new, and I started with a curiosity, pulling lines between important points, looking for patterns. And boy, I've got enough. But there is one that I do not know if it is correct. I ask you for your knowledge, to know if it is a correct line.
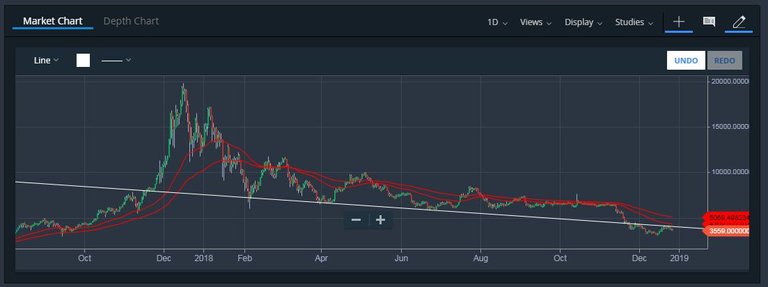
It is the image, it starts more or less when bitcoin exploded last year, and then it was descending, being touched only 3 times, in important valleys of the year.
Regards!
But coincidentally days ago, we penetrated it, and coincidentally the price has tried to rise and bounces on it, that makes me very curious.!

Well, that white line is the long term support BTC have broken weeks ago...
Now has become a major Resistance and, If BTC manages to break it we may consider that the Bulls would be back...
good observation