Cryptocurrency are new digital assets that have been created to improve the Life of people around the world, since the creation of bitcoin in 2009, this technology has improve the life of many people around the world .
This traders that have made their wealth aroundd trading this options, where not luck or have been destinated to become rich using this tools , they have take the right knowlodge trading Bitcoin and others crypto .
In today article, we are going to speak about MACD '' Moving Average Convergence Divergence '', one of the most powerfull trading tool used by experts and investors of this industry .
This indicator is a trend following momentum, that make the relationship betwen two moving average of an assets .
This tool is calculated by substracting the 26 Exponential Moving Average from the 12 Exponential Moving Average, the result of this operation is Called the MACD line , a nine da EMA of the MACD is rhen plotted on the top of the MACD line wich work as a triggger for buying and selling singals for cryptocurrency traders .
When the 12 EMA cross the 26 EMA above the signal line it's a bearish signal, and this signal is confirmed when the MACD fall below the signal line, Conversely when The MACDD rise above the signal line , this is a bearish signal and it's confirmed by the cross of the 12 EMA of the 26 EMA under the signal line , traders wait always for the MACD to cross above or below and also the cros of the 12 EMA of the 26 EMA for a double confirmation of the buy or the sell signal .
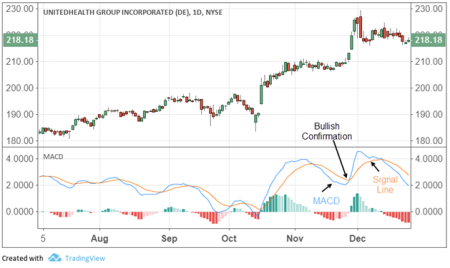
When the MACD cross above the signal after a brief correction with a longterm uptrend it is a bullish signal .

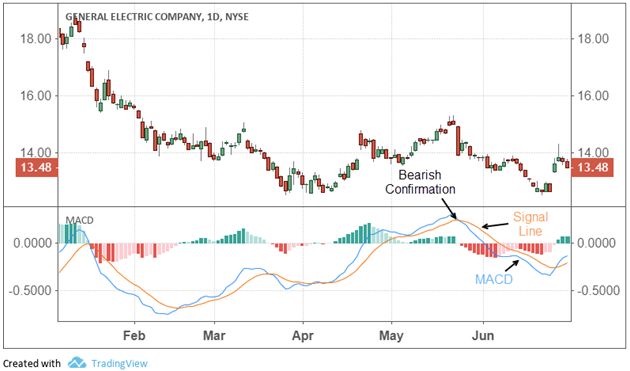
When the MACD cross below the signal line after a higher within a longer-term downtrend, this will be a bearish confirmation .

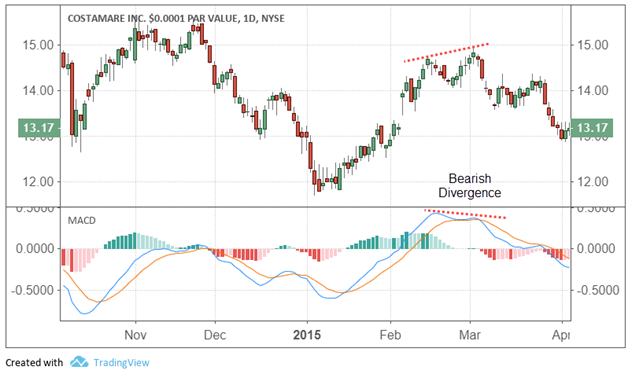
When the MACD form two rising lows that correspond to two falling lows it is a vali bullish signal when the longterm trend is still positive , is technique is one of the most reliable tehcnique in trading . When the MACD forms a series of two falling highs that correspond with two rising highs on the price, a bearish divergence has been formed. A bearish divergence that appears during a long-term bearish trend is considered confirmation that the trend is likely to continue.
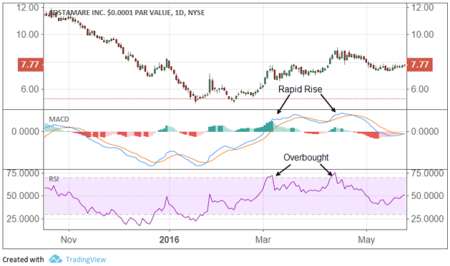
When the 12 EMA is pulled away from the 26 EMA is s a signal that the asset is overbought or oversold, an will soon return to normal levels , to confirm an overbought or an oversold traders use ofter and Combine with the RSI ( Relative strenght index ) .

Some experience is needed before deciding which is best in any given situation because there are timing differences between signals on the MACD and its histogram.Moving Average Convergence Divergence (MACD) Summary .
MACD is a strong tool used in crypto trading , but the use of this tool need to be combined with others tools, to run sucessfull traders , for this reason it is adviced to use others indicators such as RSI andd EMA .
If you have any question related to MACD i advice to read this article
If You have any questions related to cryptotrading make sure that you ASK on our free facebook groupe for crypto learning here .
If Your are looking to learn also crypto trading , i have made a book where i teach how to trade that you can get here .

Hi! I am a robot. I just upvoted you! I found similar content that readers might be interested in:
https://www.investopedia.com/terms/m/macd.asp
Yes I have mention in my article , thank you and keep the good work