Hello,
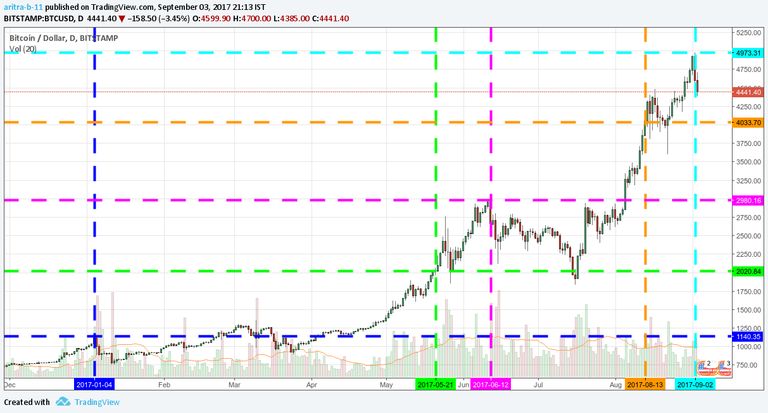
Lets take a moment of Bitcoin's achievement. On 2nd Sept 2017 BTC/USD touched its All Time High at 5000$. In fact, the year 2017 has been a bull run for the Bitcoin. We saw multiple All Time High achieved by Bitcoin. At first at 1000$ BTC created history. But then, over the course of next few months, it repeated the history again and again with price point reaching 2000$, 3000$, 4000$ and latest 5000$. Lets take a look into the time frame on which it has happened in the picture below:

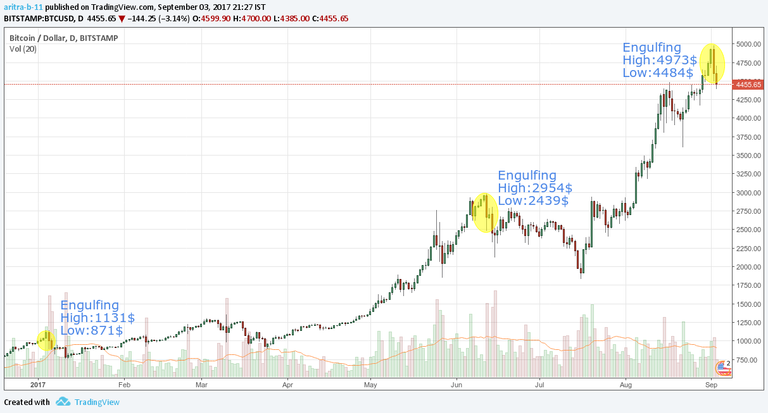
But 3 out of 5 times, when Bitcoin reach a new high,we saw an immediate pullback. It happened in the 1000$ mark in Jan 2017,
3000$ mark in June 2017 and now in 5000$ mark in September 2017. Lets have a look into the Bearish Engulfing patterns in the 1D interval for 2017:

So the pullback is not a new thing. It has happened in the past. If we study the chart for this year alone, we should expect it as soon as BTC reaches a new All Time High.
But the real question remains, when the trend will end? More specifically, how can we position ourself as a treader to take advantage of this bear trend.
I will answer this in later posts. As of now, do not invest in Bitcoin if you are a short term treader.
Remember, patients is the key in Crypto Currency Market.
Psychological resistance is a real thing in the market and I think your chart shows it. Big numbers often take a few runs to overcome. I am not surprised at the pullback. I thought it would overshoot a bit before retracing but the 5000 level was just too strong.
I look for consolidation for a while before BTC moving past 5000 and making a run at 6000. We might get a larger pullback at the 6000 level depending upon how fast the run up is.
True, I was looking forward to 6000$ mark too. At least my Fib retrace predicted it. I discussed about it in my last post : https://steemit.com/bitcoin/@aritra/step-by-step-ta-of-btc-usd
Was a good read that post!