Daily Tech Pick
Enigma (ENG) | $1.50 USD | 0.00023715 BTC
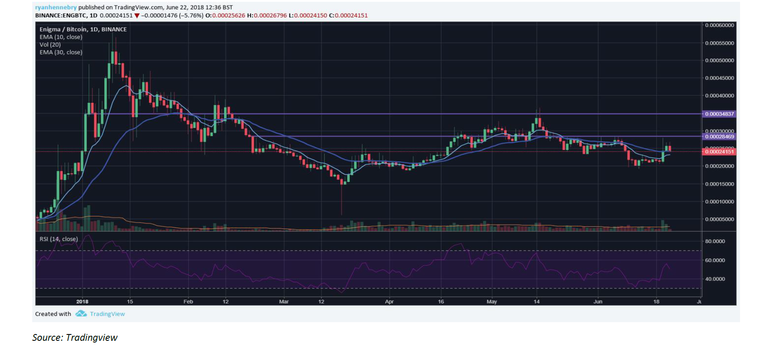
Since the near-term low of last week, Bitcoin had been forming a bear flag on the daily chart. Over the last few hours, BTC broke out of this pattern, as expected, sharply to the downside with strong volume. This does indicate market capitulation and could lean bullish long-term if a higher low can be established on the close of today's daily chart. That low may have already been established at the $6300 level, where considerable buy-side volume can be seen on the 1-hour chart. Although, with much of the trading day still to go, this remains to be seen. The key level to hold is the $6100 near-term support level, a break of this would lean incredibly bearish and likely lead to a quick sell-off as there is little support from here until $5000. Alternatively, a more bullish outlook would see Bitcoin establish a higher low here and then retest the longer-term trend resistance line over the coming week, which will be in the higher $6000 range. If so, this will be the ultimate test for the market sentiment for the coming period, a break of this level with strong volume would lean especially bullish long-term and vice versa. Finding good buy opportunities on days like these are few and far between, although certain names appear to have established a long-term low versus BTC and are waiting for positive sentiment for a breakout. One such coin is Enigma (ENG). Over the past few days, considerable buy-side volume has occurred, which has now formed a long-term double bottom on the daily chart. The general rule is the longer a pattern plays out, the greater the return will be when it decides to. Thus, ENG could provide excellent returns at these relatively low prices. ENG is now sitting comfortably above the 10-EMA on the daily and precisely on the 30 EMA, in the coming days, these two indicators appear likely to be positively crossing. If so, this would be your first indicator in a tough market for confirmation of a long-term uptrend. For those who are more patient and want to see how BTC plays out before entering any positions, a close above the 0.000285 Satoshi level on the daily would be final confirmation if the market is bullish. From there, the potential for a 22% move is likely, to the 0.00035 resistance level followed by a test of all time highs if this level is broken. As always, in situations where the market sentiment is uncertain, tight stop losses are advised to project capital. Although, with an expert team from MIT and the testnet going live on the 30th of June, this decentralised project could have a great future ahead of itself. Be sure to put ENG on your watchlist.
ENG/BTC Daily Chart

