Hi again,
this is going to be another short post. Just a small update on Bitcoin's short term path. As always I am in not a financial advisor and this post is for educational use only.
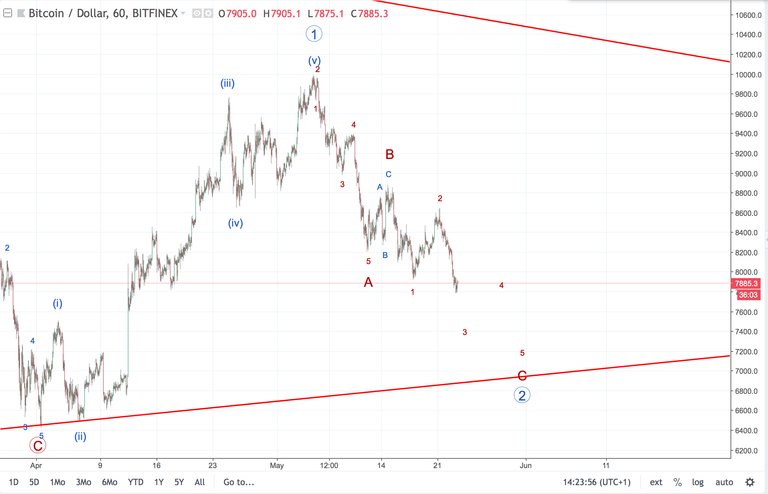
This first picture shows Bitcoin's current path. Its a simple ABC correction. Five waves down, three waves back up and then another 5 waves down.

For quite a while I was debating where the first five wave structure ended. Either, where I have marked the A on the pic above; or move it down a pivot to where the first wave of the third corrective wave started. I decided to stick to the former as we get a nice ABC wave back up to complete the second wave of the correction.
Where are we going now?
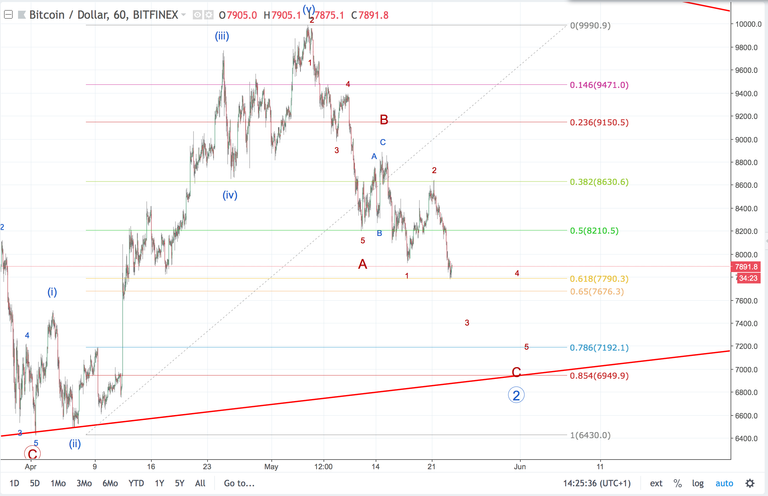
I personally think that Bitcoin still has some more correcting to do before we go back up. Yes, it has already perfectly corrected to the 0.618 level but I feel that it still has to bleed more. Also, the current wave structure doesn't support a run back up to 10k just yet.

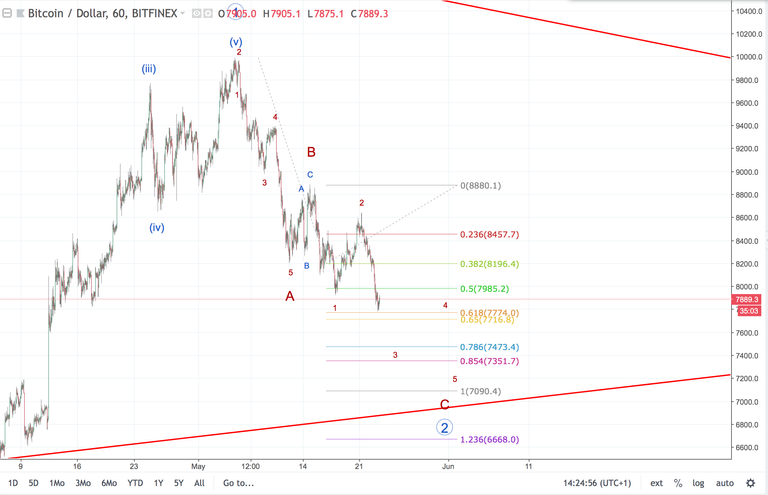
This last picture shows all the points at which Bitcoin could bounce. To find these fib levels I took the extension of the A wave and translated it onto where the B wave finished. The current bounce coincided with the 0.618 level. Watch for any more bounces at these levels as we move further down.

Thanks for reading!