Hello,
this is only going to be a small update post. Bitcoin didn't follow my bearish path I posted in the last blog. I misjudged the Elliot Wave count. As always this is an educational post and should not be taken as financial advice.
- The last two months

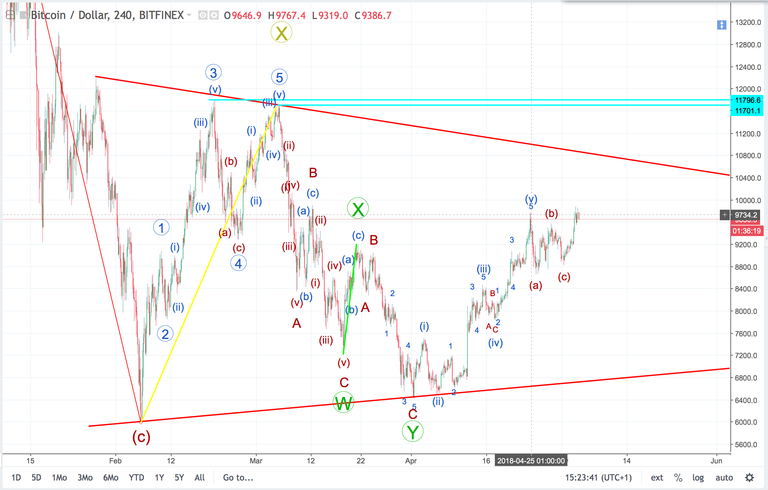
The detailed count in the picture above outlines Bitcoin's price over the past two months. I have also changed the background colour to white for this post as I found it was much easier to see all the different counts.
Bitcoin reaches a low on 06/02/18 and then impulse out of that with a 5 wave structure (marked with the yellow line), in the last two blogs I couldn't work out which peak was the ending 5th wave for the impulse but I have decided that the second peak is more likely. We then correct with a classic ABC (5 waves down, 3 waves up and then finishing with 5 waves down).
I then then think there was another mini impulse wave out of that low (marked with the green line), another ABC correction follows but with an extremely extended C wave. This is where I mark the correction to be over, however I am still not completely convinced. Normally a retracements stops near a fib level, however this correction finished bang in the middle of 0.854 and 1 (unless I am missing an important fib level in the 0.9 region).
- Future Path
This is where it gets a bit confusing, I have two possible counts. The first count is the path outlined in the picture above, we have completed the first wave up and also a very shallow truncated second wave (which doesn't really follow the normal characteristics of a second wave). This means that we are now in the 3rd way up and going to retest the red trend line.
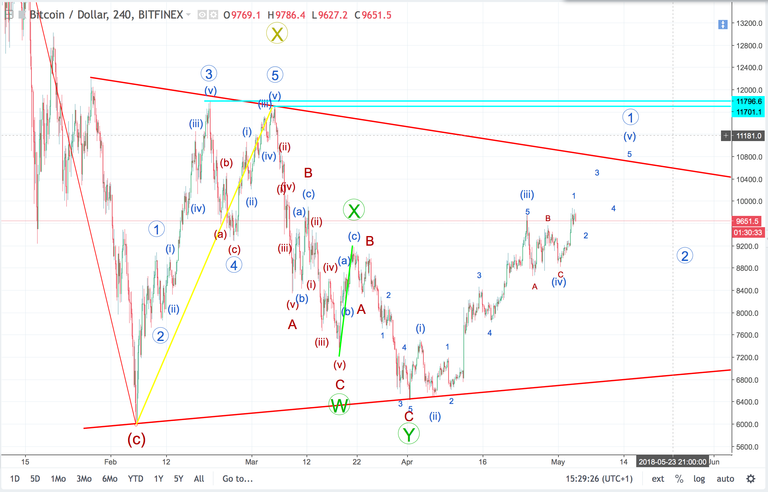
The second count I have is highlighted below:

To me, this looks more realistic. A shallow truncated 4th wave isn't as unusual as it occurring in a 2nd wave. We have a bit longer to go until we finish this first motive wave and after that we will start to correct into the 2nd wave.
- A spanner in the works
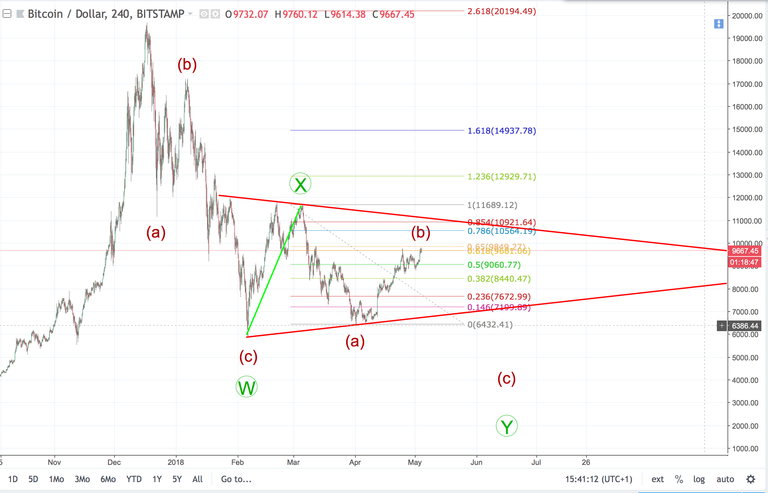
Can you imagine if after all this time we are actually only half way through our Y wave shown below.

This is definitely still a possibility. It could just react badly off where the upper red trend line and the 0.854 fib level intersect and plummet to new lows. Who knows what is going to happen.
BTC moving a lot slower than I expected, but price action looking good for the summer!
Indeed, looking bullish over the next few weeks but I still expect it to fall further over the coming few months (hoping it will). The more it retraces now the better prepared it will be for the next massive bull run!
Congratulations @benharmer! You have completed some achievement on Steemit and have been rewarded with new badge(s) :
Click on any badge to view your own Board of Honor on SteemitBoard.
For more information about SteemitBoard, click here
If you no longer want to receive notifications, reply to this comment with the word
STOP