Hey there!
This is my first post on Steemit! I have only just started learning how to trade (about 2-3 months) and before actually investing any money I want to test my knowledge and do some "dummy" trades without any money.
This post is just to create a discussion and to see what the community thinks is going to happen in the short term. I am in no way a financial advisor, I could be completely wrong and if you see anything that disproves my counts please let me know!
I have been studying Bitcoin since the start of the correction and have come up with two possible scenarios that could occur:
The bearish view:

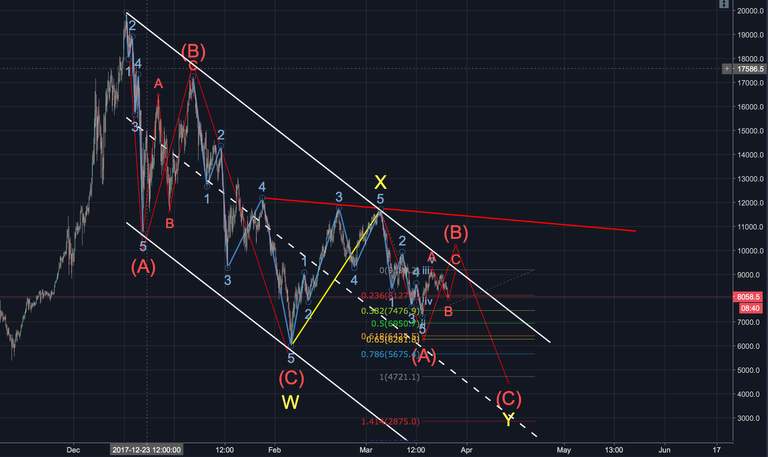
Bitcoin corrects further and reaches lower lows. I have come up with this by treating the wave up from 6000 to 11700 as an impulse after a three wave correction. From Elliot Wave Theory another ABC correction should follow (I think?) which creates a double three corrective pattern. We have already completed the A wave down with a nice 5 wave structure and we are currently completing the 3 wave structure up making the B wave. I am thinking the B wave will finish roughly around 9200 as there is major resistance, this would create a double top as shown by the white descending channel. I have then taken a trend based fib extension from the X down to the A and drawn up to where I think the B wave will end. This gives a 1-1 projection to roughly 4700 but this will obviously be a bit higher if the C wave finishes above 9200. This will signal the end of the correction.
The bullish view:

OR

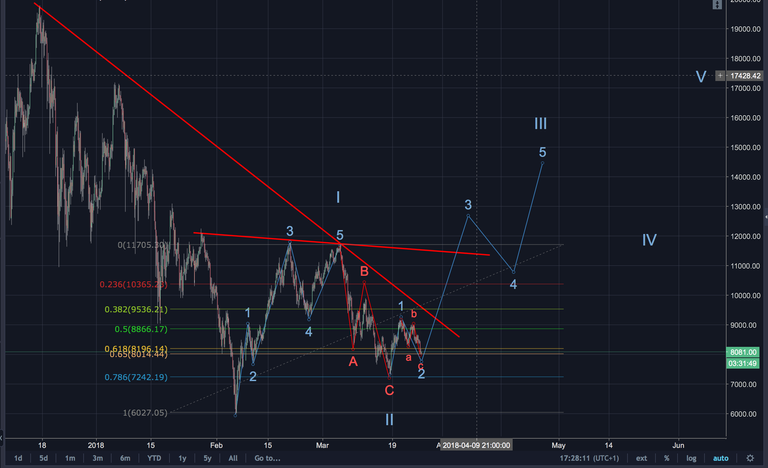
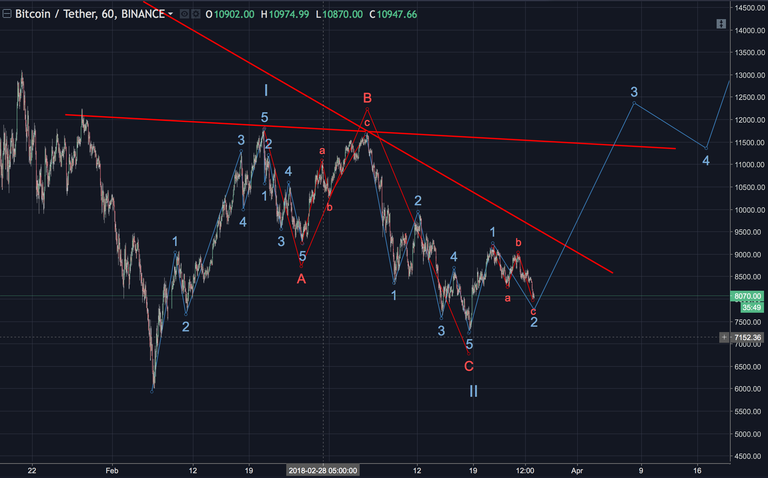
The second bullish scenario is more detailed, gets rid of the double top created in the first wave and shows a long extended c wave. However, there are a few wave 4s crossing over with the wave 1s in the second scenario which I know is a big no in EWT. Either way, both scenarios treat the low of 6000 as the end of the correction. Seeing as we have completed the correction, we have now finished both wave 1 and 2 of the next wave out of the pivot low with wave 2 being a perfect .786 Retracement of the 1st wave (a very good sign).
Long term view:

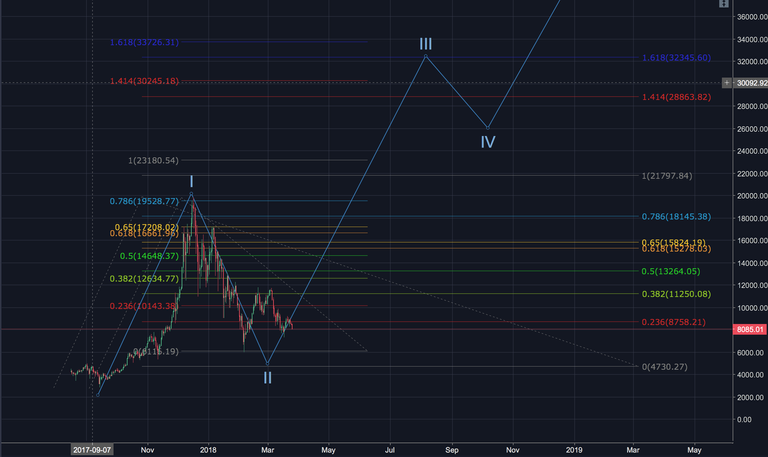
No matter what the low is, wave 3 of the larger picture looks to make new all time highs. With the conservative view being a 1-1 extension (between 21800 and 23200) and the bullish view being a good 1.618 extension (32300 and 33700).
I personally am bearish in the short term but what do I know...
Thanks for reading!
Very nice, Will be looking forward to your posts. Up-voted: hope you will visit my blog