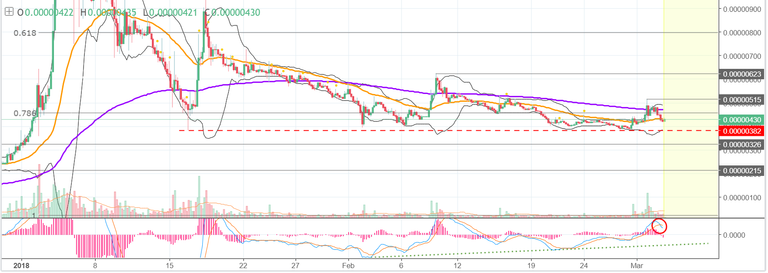
Welcome friends, to this update analysis on TRON! Let's get right to it. Looking at the four hour chart, we can see that TRX/BTC remains in a state of weak sideways trading. You can see that each time Tron tried to rally, the sellers came in and pulverized it over time. From the all time high, it was sold, then a lower high on 1/18 was sold, then a lower high on 2/10 was sold, and now the sellers are chipping way at the rally on 3/2. You can see that each of those aforementioned rallies have had consecutively lower peaks, which shows that the buyers are dwindling away.
The current price action is breaking below the 50 EMA (in orange) which has been a good strength indicator. This breakdown below the 50 EMA , suggests that more downside could be in the cards for Tron . The main level that we want to focus on here, is the dotted red trendline , at 382. If TRX/BTC begins to break below there, the next level of support will be around 325. The support and resistance below there is sporadic and relatively insignificant, so Tron could see some accelerated selling, if it breaks below 382 and 325. Also, you can see that there is a bearish crossover on the MACD , which confirms the return of the sell-side pressure, making a continuation breakdown appear likely.
On the upside, if Tron takes out the recent high from 3/2, at 515, that would be a bullish sign, which would put a target of 623 on the map. For now, that doesn't seem likely.
