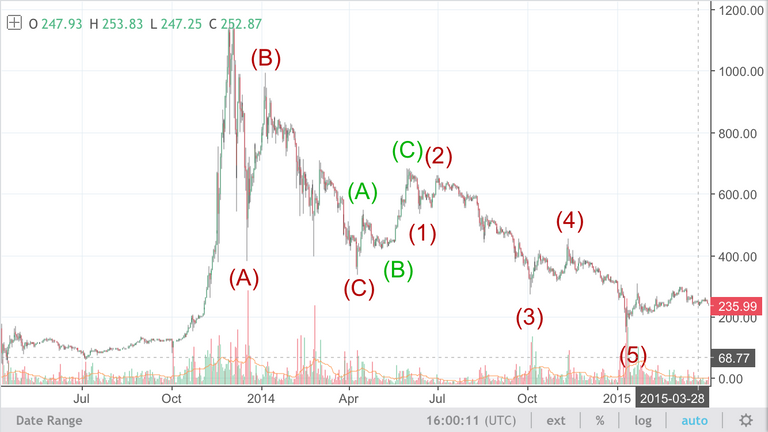
The graph above shows a major crash back in 2014 around the same months we are in now and it is very similar to the crash we are having now in 2018
(My wave counting might be off but same destination either way)

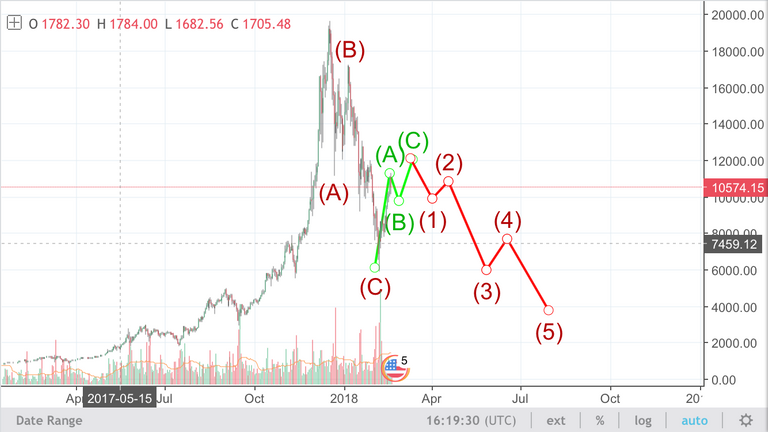
Here is current crash with what is expected to happen similar to the crash in 2014. History tends to repeat itself.
The difference seems to be this crash is happening a lot faster than the one in 2014 but that makes sense consider bitcoin is a lot more popular now than it was then.
Meaning this correction shouldn’t last as long. And then after this final lower low, we should see higher highs of $20k+ in the months to come.
We will just have to wait and see what happens, be prepared for anything.
I tend to agree with your analysis. I'm assuming that the chart above is for illustrative purposes only, and that you're not expecting the final correction to occur sometime in August or September. Thanks for posting.
Yes the correction shouldn’t last that long, we will just have to wait and see.
Congratulations @bitshareboy! You have completed some achievement on Steemit and have been rewarded with new badge(s) :
Click on any badge to view your own Board of Honor on SteemitBoard.
For more information about SteemitBoard, click here
If you no longer want to receive notifications, reply to this comment with the word
STOPI also think that the correction is not over. But I don't think that 2014 crash is going to repeat itself. Something very important would have to happen to make it happen again (Tether crash, for example).
Here I did a count similar to yours but not so long:
https://steemit.com/bitcoin/@ilcapo1/cryptocurrency-market-analysis-in-depth