Bearish or Bullish?
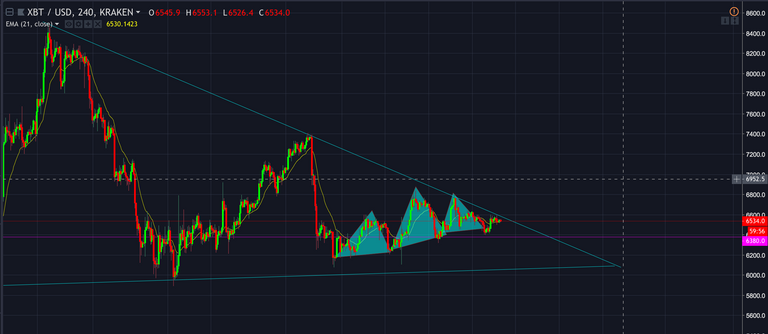
Bitcoin has formed what looks like a Head and Shoulders pattern on the 4hr. It is following the short term descending trend line, continuing to make lower highs.

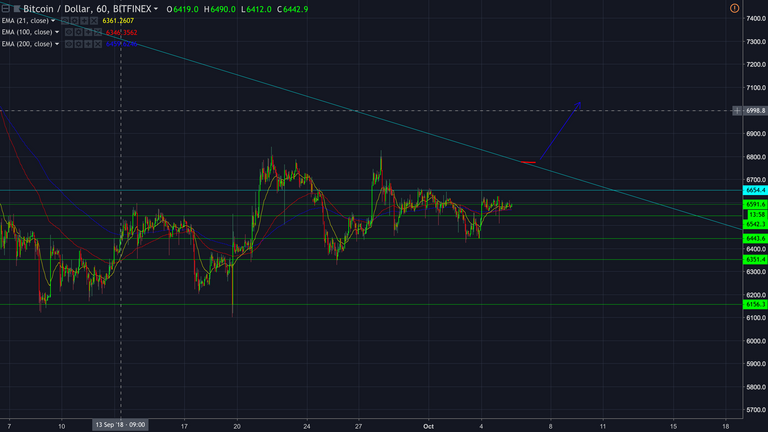
However, as we can see below, there are several support levels holding us up (green lines). With a break below the 6540 level, we will see a move down towards the next support around 6440 levels.
On the flip side, as the triangle is narrowing, if we have break to and above the 6780ish level, I do not see much stopping us from a move even higher. The 6780 level lines up pretty damn well with prior action (resistance) from the end of June. I think a move above this will create much more upside momentum.

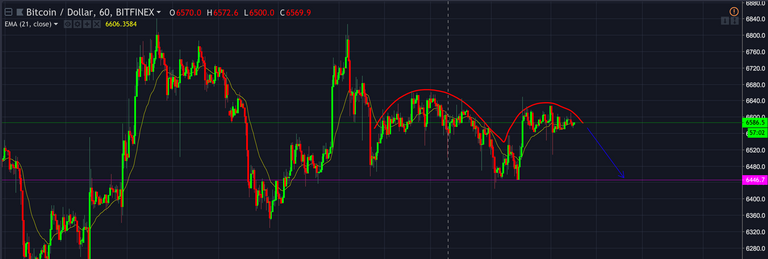
In addition, we have a inverse cup and handle formation on the hourly. This is a bearish sign. If this formation forms fully, I think it is likely to expect a move to the downside, at least to the 6450 or 6300 level. I looks to me like this formation will play out, so my expectation is to see a move down to these levels.

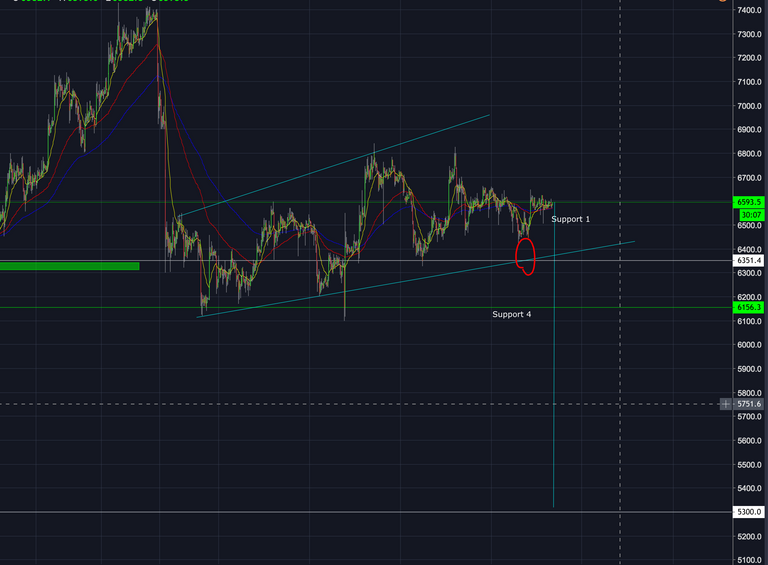
It looks something like a broadening wedge-ish type formation, perhaps even a rising channel if you'd like to call it that. It could be a rising channel if you were to draw it that way because it does have 3 touches. Either way, both are typically bearish patterns. It doesn't mean it will always be resolved to the downside, but the statistics would be on the side of that.
Regardless, more importantly if we were to break the bottom of this so called rising wedge (highlighted with the red circle, which does align with horizontal level at 6350), we would likely have a measured move. Now, the intersection of these two points provides confluence, which is something you always want to look for because it gives more validity to your analysis.
But a measured move, what do I mean by that? Well first of all, while this is up for interpretation, I am going to make the assumption that this can be called a bear flag. This would initiate the measured move I am talking about. If you draw a line from the 7400 top all the way down to the 6100ish bottom, and bring that line over to present time, you will have the estimated move. This move is shown with the blue vertical line extending down to the 5300 level.
However, I did make a mistake on this chart. I placed the line around current price. A measured move should start from the level it breaks at (in this case, the 6350 level). So placed correctly, this measured move would take us down around the 5100 level. Now, either way, its not perfect and it doesn't need to be. This is a rough estimate of where price would head towards if this move was initiated. I will come out and say that this is a less likely scenario, but it is still on the table.

My Opinion
While I do see quite a mix of Bearish and Bullish signals, at this point I am leaning towards Bearish. It looks like the Bulls are losing some momentum. Now I have no place here to say how Bearish, but I do see some downside movement in the short term. While price has been remaining fairly steady as of late, volume looks to be dropping off. Even if we did bottom out around the 5800 level, I still think we can expect to see tests of recent support levels. I am not long-term Bearish on Bitcoin or any cryptos for that matter (I am extremely Bullish). I am honestly hoping for some lower prices because I want to BUY MORE! So there is my opinion, take it or leave it, like it or hate it. Comment below and let me know your thoughts.
Disclaimer
I am by no means a financial advisor or trading expert. Please do not interpret my analysis as fact or advice, I am simply sharing my analysis and viewpoints. Please share your opinions, I like to be proven wrong.
Follow @blockchainbros and stay up to date on the latest news and analysis in Cryptocurrency and Traditional Markets.