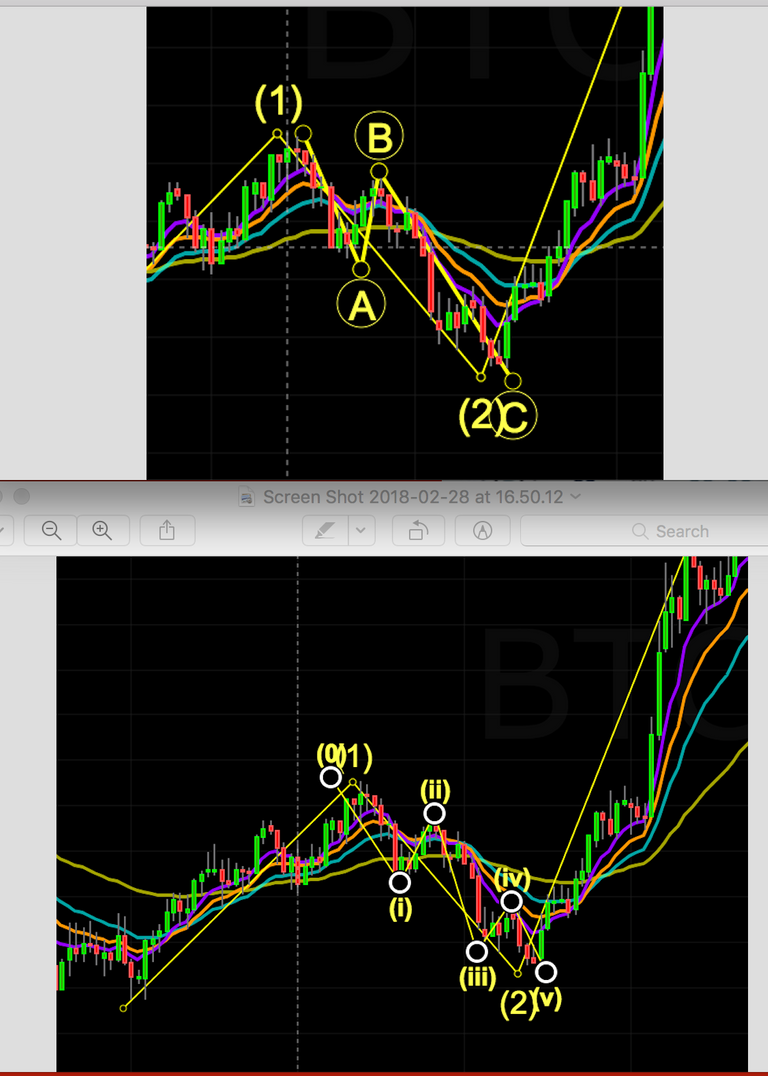
You mentioned that the last 5 wave count could look like this. Something which often confuses me is when it's possible to count a 3 wave as well as a 5 wave structure within the same area of a chart as you see in the pic below. Seems 5 waves fits much better but that would invalidate the second wave going down since it should be an ABC type structure right?

You are viewing a single comment's thread from: