byscagJanuary 20th. Let's dive right in..Welcome back to another #technicalupdate . In this post I will follow up on my #bitcoin analysis from my last technical update on
BTCUSD
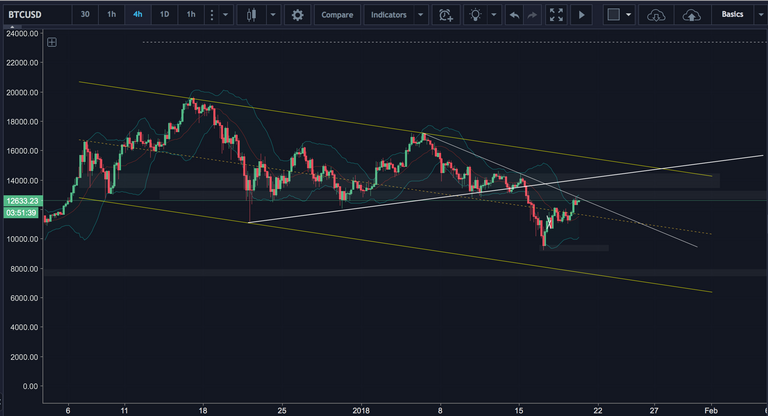
The last time we looked at bitcoin it was just approaching the $13,000 level as shown in the chart below. I had suggested it was possible we broke the trend line we were testing before coming back tumbling down towards the recent lows. I was mostly interested in the backside of the trend line/upper channel.

Although price did briefly pop above that trend line we did not get anywhere near enough demand to reach for the top of the channel. We were once overwhelmed by supply and price came right back under as fast as it broke through. With that rally back down we came to establish a new higher low back down at the $10,000 level. A retest of the demand. Since that time we have slowly tried to crawl back up but the $10,000 level has been a magnet thus far bringing a new retest to it today.

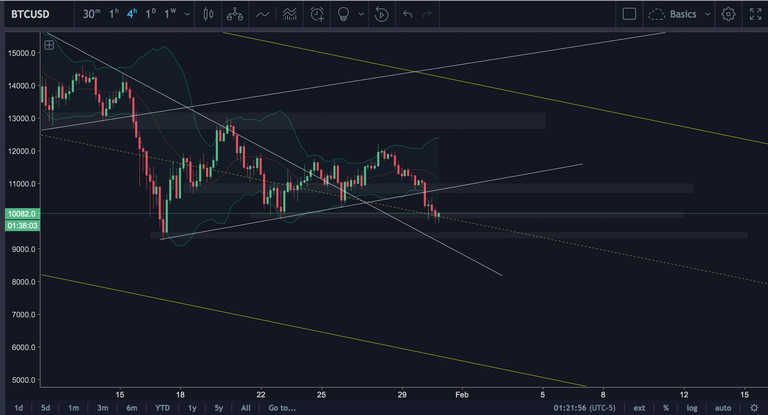
As you can see above today's retest included a break in the trend line that was previously holding price up as it ranged after the double bottom. Price has also found itself resting perfectly on the middle of the longer term bear channel. I do believe from here we will find a short term recovery; and that is when I will be most interested in watching price action.
The big question that remains is whether or not the $10,000 level will hold. It's a huge psychological level that has been retested for the last few weeks after a very impressive rally to nearly $20,000. It is also the middle bollinger band on the weekly, massive support on the daily and been a level to play off of on all intraday charts for weeks.
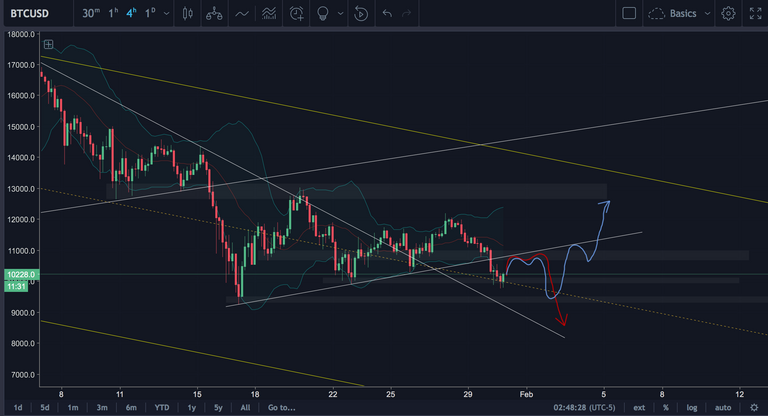
If the bears have any power left in them, we should see more selling and a final push to break this level and close under $9,750 from the backside of the trend line we just broke and meet the middle band again on the 4hr chart. This is where I will be watching the market carefully. Bears are still apparent, and bulls have been putting up a good fight; but it's time for one of them to really show their power and decide.
Let's take a look at the theoretical options that our magic brush can predict.

Which side are you on?
I will be playing the reaction at the levels I have marked, whether that is up or down will be decided in the moment and you should make your own decisions when it comes to trading.
Nothing better then a bit of TA, thanks for the post bro it was nicely formatted
📈 appreciate it and thank you ✌️
I think BTC will hold around 10,000 for a short time, then go up steadily over the course of the quarter. Exciting times to be in this industry.
I could've sworn I already commented on this one.... but I'm wondering what's going to happen 2/1.... craziness should be coming soon.
Congratulations @byscag! You received a personal award!
Click here to view your Board
Congratulations @byscag! You received a personal award!
You can view your badges on your Steem Board and compare to others on the Steem Ranking
Vote for @Steemitboard as a witness to get one more award and increased upvotes!