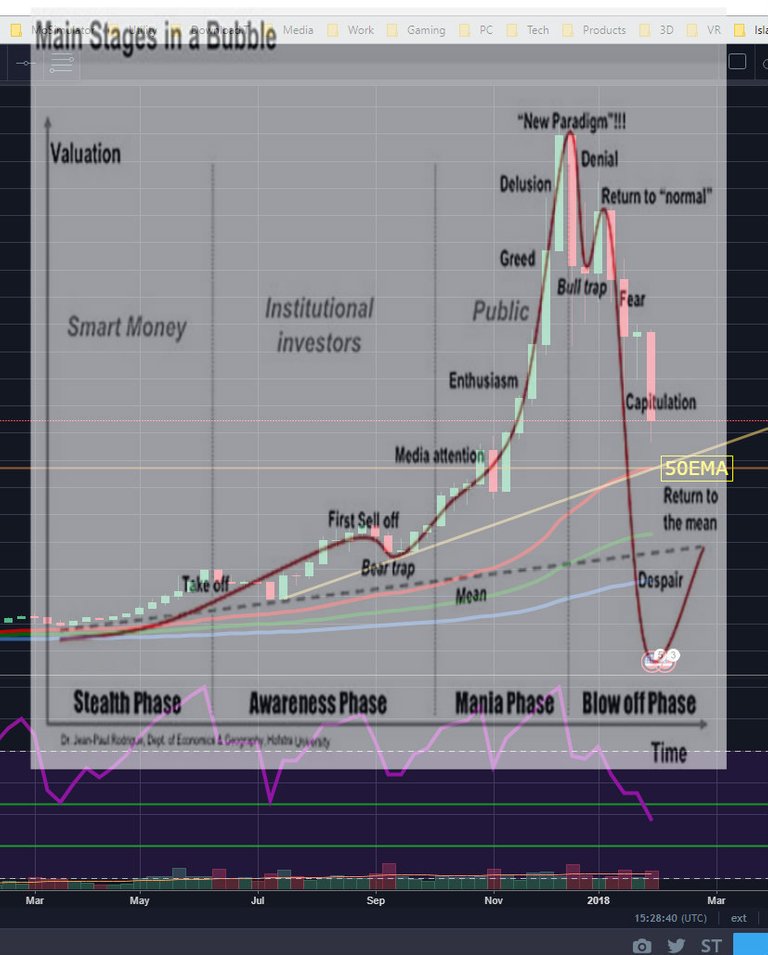
@haejin The RSI is currently in new lows. If the weekly candle close at current value it will surpass the 14 week RSI support at 53. The 5th leg that u mention could well be at the 50 weeks EMA, which next week will be 6700. Now my concern is this chart looks astonishingly similar to the typical bubble bursting chart that i got from google image.
You are viewing a single comment's thread from:
A Bubble moves in an impulse, but an impulse doesn't imply a bubble. Make sense?
P.S. - His 21k followers are complete bullshit and most are inactive and have been for months.
If you are receiving this message, you have been flagged for responding to a known scammy piece of shit. Enjoy your dwindling rep. Here is how @haejin supports the community.You can rest easy, as that bubble chart isn't even close. Compare the dot com bubble with cryptos and it's not even the same ballpark. Could crypto bubble some day? Sure, it's a possibility. But one must zoom out and consider all the factors... we aren't even close to a bubble yet.
Very good information. RSI though is not oversold until it's below 30, so it has a lot of room and this would support the a trend toward your 6700 target. The overlay to the typical bubble bursting chart is freaky similar. Thanks for sharing.