Are you excited about the crypto market at the moment? Well, so are we. However, since our job is to look at technicalities before getting ahead of ourselves, let's take a look at what Bitcoin is doing at the moment. This will be a huge Bitcoin (BTC) price analysis. We are going to dissect BTC's movement to bare bones in various environments with various indicators to bring you as much data as possible. Therefore, enjoy it!
During the last week, Bitcoin investors started a rally from $9,100 to the current price of $11,240. This a 23.6% increase in just 7 days, which is by no means unimportant. Especially during the shaky global economic and political situation caused by the COVID-19 crisis and civil unrest in the USA.
Nevertheless, as we said, we are here to talk technicalities, so let's get straight to it.
Bitcoin Price Broke the Long-Term Resistance
To start with our Bitcoin (BTC) price analysis, we are going to take a BTC/USD daily Coinbase chart because it is always great to look at the big picture.
The first thing that we have to acknowledge is that Bitcoin has finally broken the declining resistance line. This is even more significant since we know that it was impregnable since early 2018.

Just by itself, this is a fantastic piece of information. Especially because the breakout happened in such a violent manner. Yet, this, by itself, doesn't mean that we can sit on the sofa and relax. Far from it, in fact.
Such a wild movement of a cryptocurrency always calls for more caution and this time is no different. Therefore, let's dive deeper to see which levels are there for BTC to test on the way to a possible new all-time high.
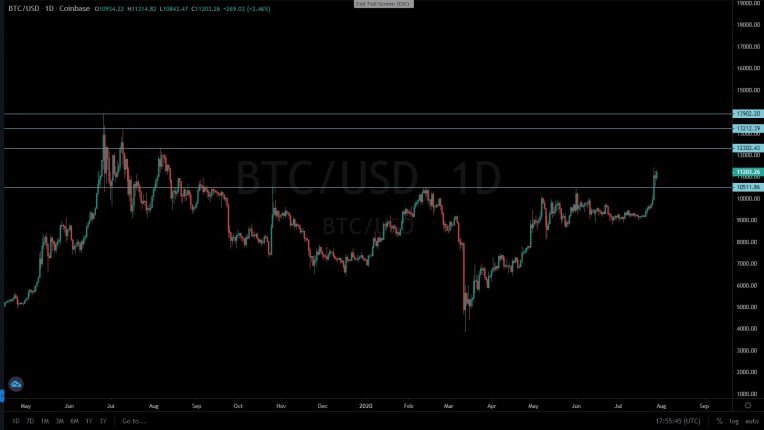
As it is clear from the chart above, Bitcoin just shot through the crucial $10,500 after being rejected by that level 4 times before. When the resistance manages to hold the surge so many times it is easy for investors to lose trust towards the asset and instigate a sell-off. However, the crypto HODLers proved to have strong hands as the price moved horizontally for quite some time.
The reasons for this might be in the fact that Bitcoin recently had a mining reward halving. Investors know that such events, historically, always marked the start of a positive price movement. However, let's stick to the technical aspect of the game.
Bitcoin Untested Levels

What awaits Bitcoin in the immediate future are three more untested levels:
- $12,300
- $13,200
- $13,900 ($14,000)
The latter is, naturally, going to be the hardest to bust through. Not just since it is the highest but also because, if BTC succeeds, it is going to mark the end of a cycle that started just more than a year ago. On June 26th, 2019, Bitcoin reached exactly that price ($13,900) before spiraling down towards $3,600. Therefore, if buyers defeat sellers at that point, $15,000, $16,000, and even $17,000 will look quite possible once again.
So, are we going to see a bull run in the near future?
Bitcoin (BTC) Price Indicator Analysis on a Daily Chart (MACD & RSI)
Well, in order to do that BTC is still going to have to do it in stages. Usually, when we have a strong bull run in the cryptocurrency market, prices spike in 3 large buying sessions, best depicted by the MACD technical indicator. In the BTC/USD daily chart below, you can see historical bull and bear runs, all happening in 3 consecutive bursts on MACD.

The recent spike might have triggered the second such MACD spike, the first being when the price recovered from the $3,600 bottom. In theory, the ongoing positive movement should push the price above the mentioned $14,000, for the third one to reach any higher. Therefore, Bitcoin should reach a year's high. The crucial component for this to happen will be the influx of new money. We are going to talk more about this in one of the next paragraphs so, keep reading.
Not less important than MACD is the RSI indicator, and it looks eqally good for Bitcoin at the moment.
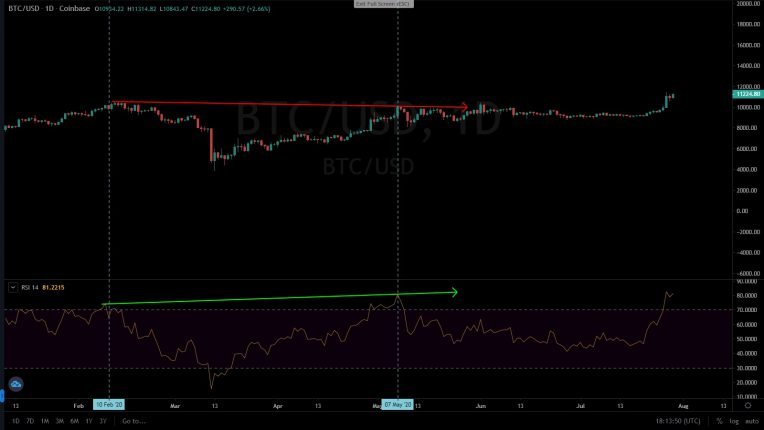
The chart above shows how investors trust towards BTC, despite the asset having a stagnant period regarding the price movement, in fact, raised. The two recent RSI spikes reveal the strength, and it was natural for Bitcoin to push through $10,500 in the third wave.
Bitcoin (BTC) Price Analysis on the BTC/USD 1-hour Chart
Besides indicators looking great for BTC in the long-run, we wanted to see how things might play out in the shorter timeframe. Therefore, now, we're going to zoom in to see what can we read from the BTC/USD 1-hour Coinbase chart.

After reaching the peak of the rally at $11,400, Bitcoin started to form a symmetrical triangle. Such formations are neither bullish nor bearish. Therefore, besides trading inside the formation, it is difficult to predict the future price movement. However, Bitcoin managed to break the triangle's resistance, which is another positive signal for the next period.
Nevertheless, our careful Bitcoin price analysis revealed something that can make all experienced investors worried. The hourly chart below shows the RSI indicator. Just like the RSI on the daily chart looks fantastic, this one is the complete opposite. While the price reached new highs, the RSI plotline failed to follow the price movement. Usually, these kinds of divergences foreshadow the reversal and are very effective in doing so.

Still, it's just a single indicator against all these positive signals, right? Well, not quite.
The Need for New Money
A bit earlier in this extensive Bitcoin (BTC) price analysis, we mentioned the new money and how it can influence the price movement. That's why we decided to take a look at what's happening on BitMEX since it is the biggest crypto derivatives trading platform.
The open interest indicator in BTC/USD perpetual BitMEX chart is a good representation of new money being invested in relation to Bitcoin. It is represented by the chart similar to how we depict the price movement. If the chart goes up, there are new contracts being signed (new money is being pumped into the market) with BTC as an underlying asset. If the chart shows the opposite, basically, there is no new money influx. You can read more about the open interest indicator HERE.
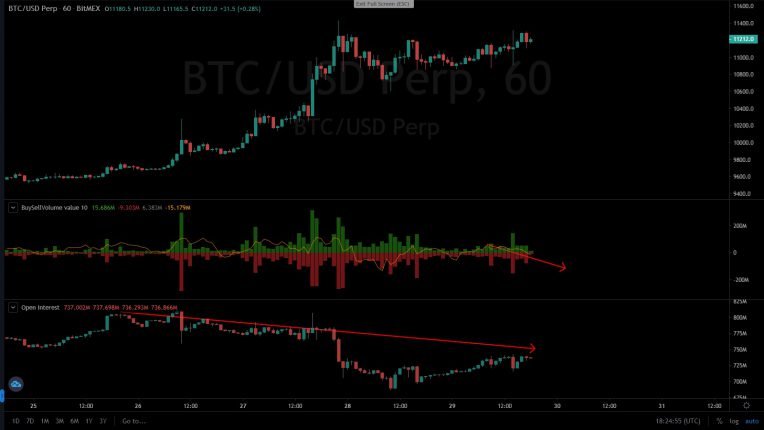
The BitMEX chart above clearly exhibits the declining open interest in the biggest Bitcoin derivatives market. This is another negative signal Bitcoin is giving to short-term investors. Because, remember, at the moment, we are looking at the hourly chart.
Meanwhile, the buy/sell volume indicator passed below the neutral value, indicating that the demand for Bitcoin and its trading products is stagnating. Both of these red flags might be neglectable in the long run but, at the same time, should be enough for day and swing traders to set up those stop-losses if they went long.
Be Fearful When Others are Greedy?
During the last week, the greed index for Bitcoin has shot up from neutral to the extreme. Moreover, just a month ago, the same index revealed that investors were fearful to invest in BTC. This is a really short timeframe for such a thing to happen. Therefore, it represents yet another thing all traders should be careful about.
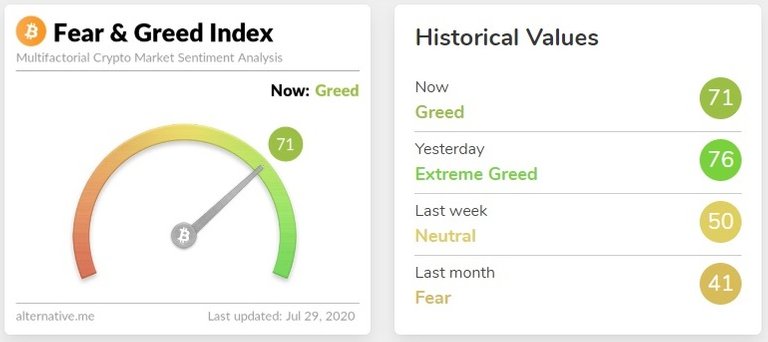
Source: alternative.me
Just to draw a parallel, the BTC greed index hasn't been so high since July 2019. As a reminder, afterward, Bitcoin plummeted all the way down to $3,600.
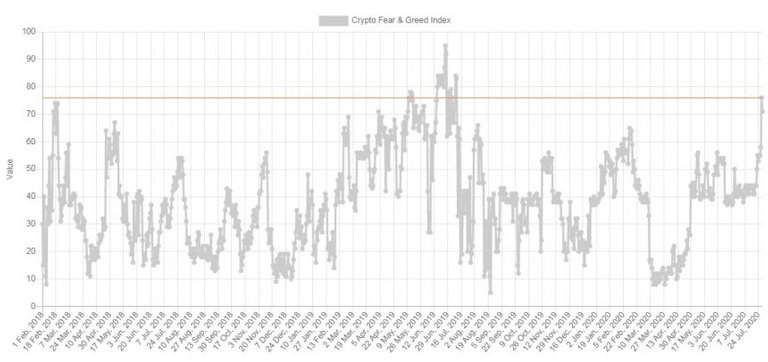
Source: alternative.me
One of the world's most famous and most successful investors, Warren Buffet stated that "you should be greedy when others are fearful". This modern proverb worked like charm for those who invested in Bitcoin a month ago.
However, he also stated that "you should be fearful when others are greedy". The market can't get much more greedy than this so, it is up to you if you are going to respect Mr. Buffet's words.
All charts in the article were analyzed on Coinalyze.net – the professional crypto trader’s analysis tool.
Disclaimer:
You should look elsewhere for investment advice since this isn’t it. Even if it looks like it, it’s not. Cryptocurrencies are extremely volatile and risky speculations. Always do your own research. Consider consulting an investment professional prior to investing your money.
Please, in the comments section below, let us know what you think will be the next BTC move. We are excited to hear your opinion.
 When you start feeling the irresistable urge to share our content and click on one of the sharing icons below, you'll be rewarded with Sharpay (S) Tokens.
Now, ain't that cool or what? Getting paid for sharing!!
Of course, to receive your tokens, you'll need a Sharpay crypto wallet. Therefore, first you need to register on Sharpay's OFFICIAL WEBSITE and the wallet is there.
When you start feeling the irresistable urge to share our content and click on one of the sharing icons below, you'll be rewarded with Sharpay (S) Tokens.
Now, ain't that cool or what? Getting paid for sharing!!
Of course, to receive your tokens, you'll need a Sharpay crypto wallet. Therefore, first you need to register on Sharpay's OFFICIAL WEBSITE and the wallet is there.
Thanks for sharing!
😉
Originally published on CoinSyncom: https://coinsyn.com/bitcoin-btc-price-analysis-can-the-rally-continue/
Hello,
Welcome to Hive.
In order to prevent identity theft, identity deception and content theft, we encourage users to confirm their online identity. Users with an online identity that have websites or blogs, users who are creators of art and/or are celebrities of all kinds, are asked to verify themselves. Verified users tend to receive a better reception from the community.
In order to confirm your authorship of the content, please mention word "Hive" or add a hyperlink to Hive in your website:
https://coinsyn.com/
You can remove this mention from your website, once we confirm the authorship.
Thank you.
More Info: Introducing Identity/Content Verification Reporting & Lookup
The link is in the footer section of the website.
Thank you. you have been verified:
https://hivewatchers.com/verifications?utf8=%E2%9C%93&verification%5Busername_search%5D=coin.syncom
Hi! I am a robot. I just upvoted you! I found similar content that readers might be interested in:
https://coinsyn.com/bitcoin-btc-price-analysis/