Hi Everyone, I am just an amateur equity/forex trader. This is my First post and I would like to share some of my technical analysis knowledge in the crypto currency market.
My Chart Setup and Technical Analysis Indicators:-
Chart: Candlestick Charting Period: Daily (Long Term Chart) 4 Hours (Medium Term Chart) 1 Hour (Short Term Chart)
Indicators that I am using:-
1. Bollinger Bands:-
Length: 21
Standard Deviation: 2
2. Linear Regression Channel (LRC)
3. Simple Moving Average (SMA):-
Dark Blue: 84 (Long Term Trend)
Blue: 63 (Medium Term Trend)
Light Blue: 21 (Short Term Trend)
4. TrendLines
Some Technical Terms:-
Bullish (Upward Trend): The past price actions indicate that the price could go up.
Bearish (Downward Trend): The past price actions indicate that the price could go down.
OverBought: The past price actions indicate that the traded pair is overvalued (eg: due to hype) and may pull back.
OverSold: The past price actions indicate that the traded pair is undervalued (eg: due to panic selling) and may trend up.
Sideway: There is no clear indication on where the price is heading.
Support Level: A floor level where the price tends to bound off. However, if the price has breached this level, the down fall could continue until the next support level.
Resistance Level: A ceiling level where the rising price tends to bound off. However, if the price has breached this level, the upward trend could continue until the next resistance level.
Cryptocurrency Pair: BTC/USD
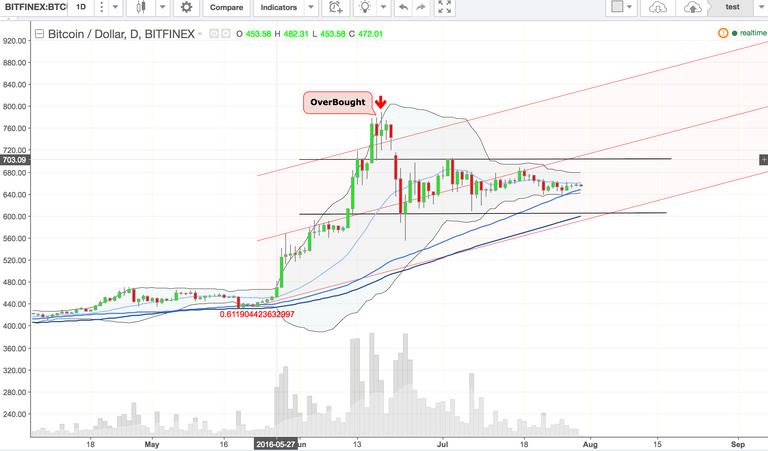
BTC/USD Daily Chart (Long Term)

On 16/17 June 2016, the price has touched the upper band of Bollinger Band and the upper band of Linear Regression Channel. This indicates that this pair is overbought, there is high chance the price would pull back which eventually happened the next few days later.
Currently the price on the daily chart has been moving sideway. Based on the trend lines, the price is expected to move between $703.09 and $ 603.48 in the near term. The Natural number $600 and $700 are always good support and resistance level.
The Support level on the daily chart: $600 - $ 603.48
The Resistance level on the daily chart: $700 - $ 703.09
If the price is breaking through the Support level, the price could be trending further down until its next support level. If the price is breaking through the Resistance level, the price might be trending further up until its next resistance level.
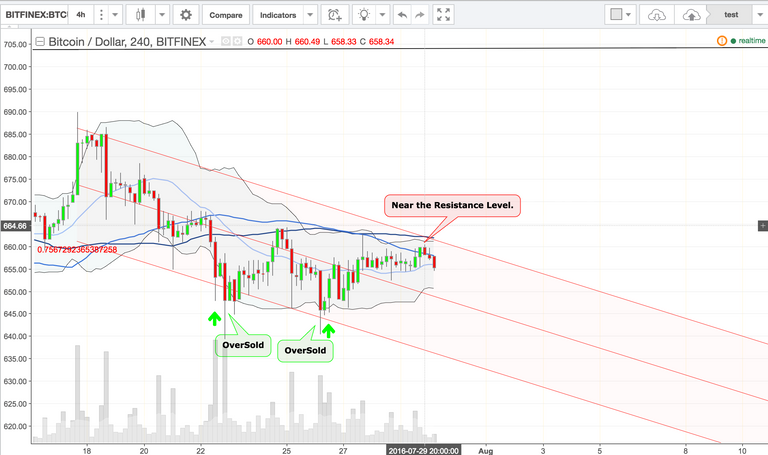
BTC/USD 4Hours Chart (Medium Term)

The price has touched the lower band of Bollinger Band and the lower band of Linear Regression Channel on 2 different occasion (22 July 2016 about 8 pm and 26 July 2016 4 am). This indicates the BTC/USD pair has oversold.
On the First occasion: The price went up from $639.60 to $663.80. On the Second occasion: The price went up from $640.35 to $662.50.
On 29 July 2016 4 pm, the price almost reached the upper band for Bollinger Band and LRC. The price eventually trending downward. The price always has the tendency to go back to the meddle line of the LRC, so the price could trend further downward to $649.32.
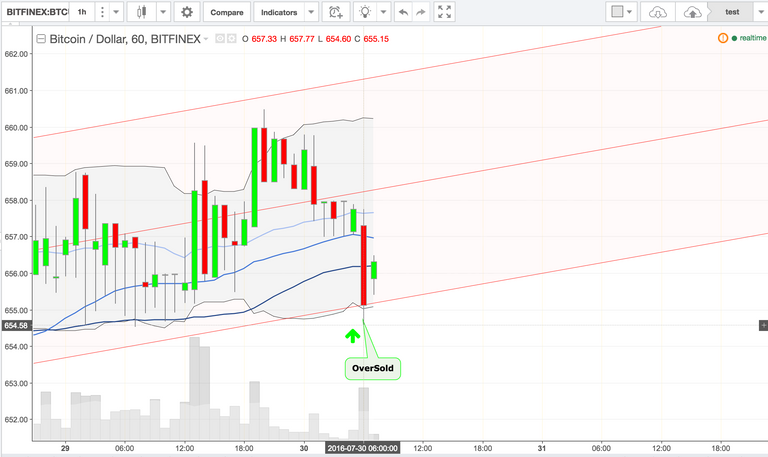
BTC/USD 1Hour Chart (Short Term)

The price has touched the lower band of Bollinger Band and the lower band of Linear Regression on 30 July 2016 about 6 am. It means that it has oversold and might be trending up in the short term. The price went up from $ 654.58 to the current price $ 656.30. The up trend could continue until it reaches the center of the LRC line which is at $ 658.30.
Summary for BTC/USD Technical Analysis on 30 July 2016
BTC/USD has been trending sideway in the long term chart with the support level ($600 - $ 603.48) and resistance level ($700 - $ 703.09).
For the medium term chart, the indicator suggests the price is trending down.
But for the short term chart, the price could be moving upward due to the oversold signals triggered by lower band of Bollinger Band and the lower band of Linear Regression.
The current medium and short term charts have mixed signals. This is usually a sign of sideway trend.
Disclaimer:-
Technical analysis is about studying the past price actions and trends. The past does not equal to the future. The past price actions can only act as indicators for the potential future trend. Use the above information at your own risk. Please consult your professional advisor before making any trades.
If you like this technical analysis, please up vote and give comments below. :)
Please let me know which other cryptocurrency pair that you want to be analysed and I would try my best to do it during my free time. No promise though. ;)
Click my name cooldude ↓ and click Follow, if you don't want to miss any of my analysis.
Great article
Piccata? Titicaca! I am Cornholio! I need piccata for my bunghole!