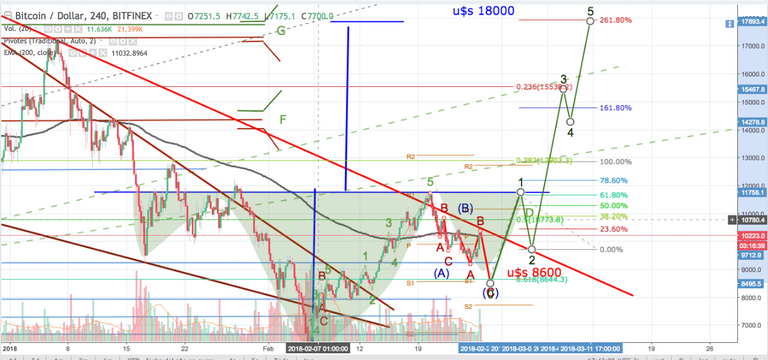
I provide analysis and graph. Possible route from the BTC to the Target of 18,000 dollars
There still will be one more wave of correction see point C
From there a rise to point 1 that corresponds to the 11,700 dollars and retension of support point 2
Up to 15,500 dollars point 3, coinciding with the fibonacci line of 0.236 and a long-term resistance line.
Correction to support of 15,300 dollars and from there to point 5, coinciding with the fibonacci line of 261%, target 18,000 approximately, quite achieved in the second wave cycles

I have posted a similar chart on this blog as well. I've labeled your blue ABC as WXY because an ABC has 5-3-5, whereas WXY has 3-3-3 (which is confirmed by both of your red abc zigzags).
Lets see who's right. 😉
Fundamentals are bullish; Technicals are still mixed imho
It's good, confirms the analysis