
TA: Bitcoin / Ethereum Price Analysis 9/13/19
Overview
Over the past two days we’ve seen a bounce off of a secondary trendline in Bitcoin as markets prepare for the launch of the Bakkt Futures on September 23rd. This anticipation is most likely the cause of uncertainty in price direction for both Bitcoin and the altcoins, the latter having larger percentage swings than Bitcoin but still continuing in a tight range relatively speaking.
Market Cap Dominance
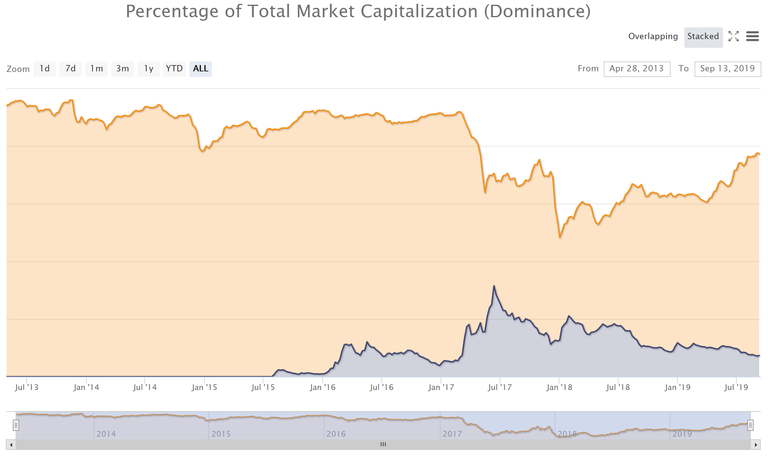
Bitcoin’s dominance at the time of written in currently at 70.2% according to Coinmarketcap.com. As statistics show, Bitcoin’s dominance continues to increase against Ethereum, the latter’s dominance currently at 7.38%. Bitcoin’s dominance has been steady at roughly 70% for the last 3 days building a potential base before heading even higher.
Bitcoin 1-Hour Chart
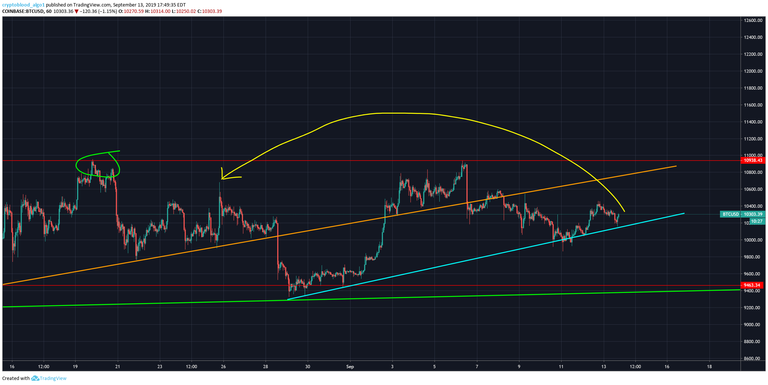
Bitcoin’s (BTC/USD) consolidation zone between $9,463 and $10,938 (both red lines) are still in play with a new bullish trendline (blue trendline) forming giving support under the market. The trendline is giving Bitcoin support at the $10,190 area, with a bias towards the upside for another attempt at breaching the previous trendline (orange trendline) at roughly $10,800.
Bullish Scenario
A breach above the $10,672 area would be a strong bullish signal for a breakout of the channel at $10,938 (red line) , so setting price alerts at that area would be warranted.
Bearish Scenario
A breach downward of the (blue trendline) will most likely take us back to test the bottom part of the channel at $9,463 (red line).
Ethereum 1-Hour Chart
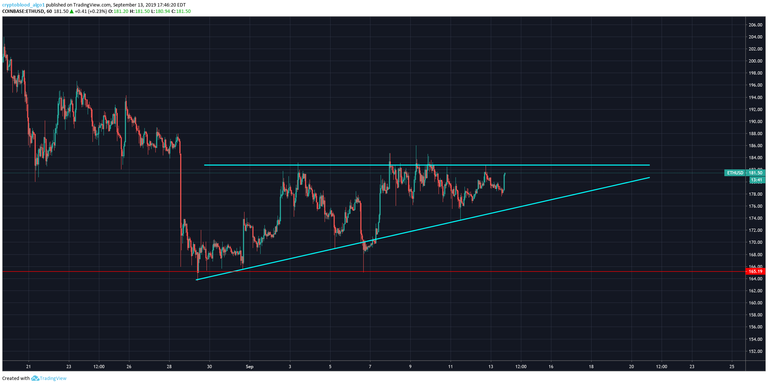
Consolidation continues within the Bullish Pennant forming (both blue trendlines) for Ethereum. The last hour candle spike in ETH prices shows a strong bias towards a breakout to the upside @ $182.89 (top blue line) for ETH/USD in the next 12 hours.
Bullish Scenario
Trading of ETH/USD above $185 for 4-6 consecutive hours would confirm a breakout for ETH and a new floor for support @ $182.89 area.
Bearish Scenario
A breakout to the downside below $175.18 would confirm a reversal and potential bearish move towards the $165.19 area (red line).

dominance is going all the way up