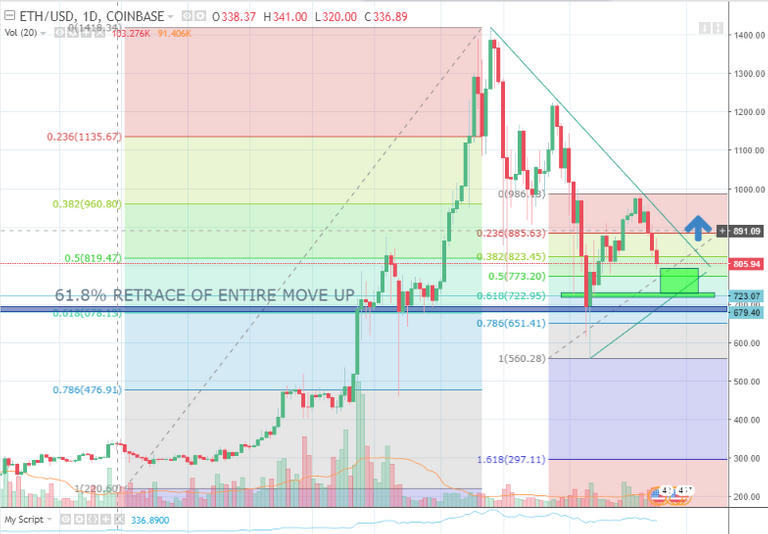
As we recently discussed ETH has bounced heavily off of the 61.8% retrace of its huge push up last year and we are looking for signs that the bounce off of that key level, can infact kick off a bullish continuation!
To find this sign we are looking to Fibonacci once again, and we are also going to analyse the way it has reacted when it hit the upper trend line a few days ago. When it hit, the price rejected strongly, and rapidly, which is still showing signs of great weakness. For this reason we aren't going to look to buy into ETH in the immediate future, but we are going to watch it very carefully as it comes down into the 61.8% retrace of the most recent move, which you can see as the green rectangle on the picture below.
If the 61.8% retrace of the big move is going to reversal point, we will start seeing a reversal confirmation and that can come in many forms. One of which is known as a double bottom.
There are many types of double bottom. The one we are looking for here is known as an Adam and Eve Double Bottom (A&E Double Bottom). This type of double bottom will have the second touch of the bottom sitting slightly HIGHER (in a downtrend) than the first touch. New higher lows can be a strong sign of a reversal and that higher low is what we are looking for here.
In the green rectangle below we are going to be looking for a strong BULLISH price action signal of some kind. All of which I have described in the Success Strategies articles.
If we get one of these signals in that area it will also be a HIGHER LOW and the signal for an A&E Double Bottom which will give us confirmation that the bounce is ready!
If we see one of these signals around the area below, I will be sending out an update with the trades entry level, stop levels and a potential target level.
Stay posted :)
Sam Broye

