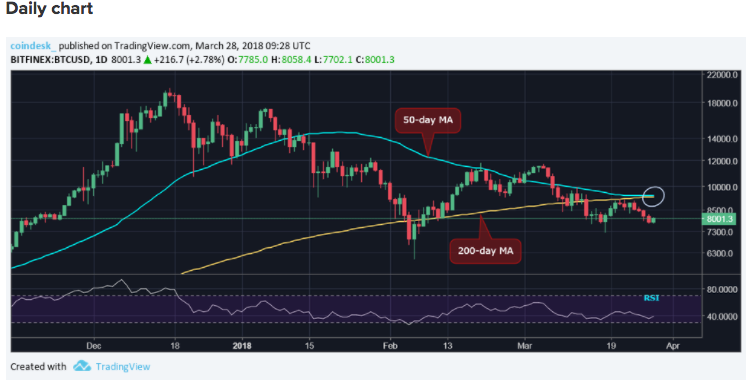
The Bitcoin daily chart is now forming what is commonly known in the TA world as a Death Cross. A death cross occurs when the 50 day EMA crosses the 200 day EMA from above. In the stock market world, this can sometimes indicate a big sell off, with some experts saying that bitcoin could drop as low as $3000.
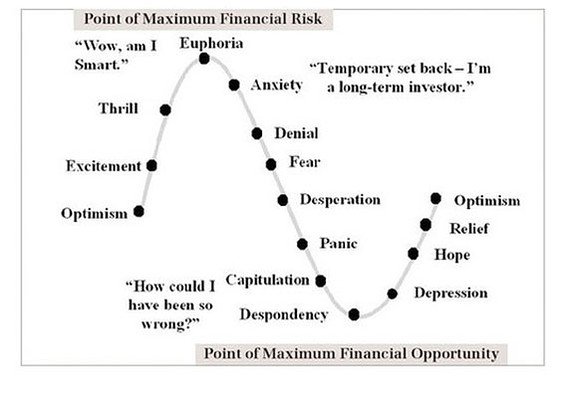
However, these fears are likely exaggerated. Historically, death crosses on bitcoin have acted moreso like a contrarian indicator, meaning that a temporary sell off occurs, but then the price begins to rally and a new uptrend starts to form. This often happens at the same time as what is often called the capitulation phase of the financial life cycle, shown below:

Though it may seem dreary and bad at first, it can also provide a point of maximum financial opportunity in a bit of a bear trap. This is the point where the bulls come out of the woodwork and begin to find hope again. From there, it starts to move back out of the bottomed out despondency phase and begins to move upward again, possibly to new highs.
Things may look bad for a hot second, but keep hope. If you have some cash on the sidelines, look forward to the near future for a possible moment of maximum financial opportunity. If you are currently HODLING, don't lose hope. I have a feeling that things are going to be looking much brighter very soon.
Signing off,
Isaiah Croatt
Chief Research Officer
CoinLion LLC
Website: https://coinlion.com
Linkedin: https://www.linkedin.com/in/isaiahcroatt/
Facebook: https://www.facebook.com/icroatt/