Bitcoin appears to be at a vital level once again, looking to either break up through former levels of resistance or face rejection down for yet another time, possibly leading to new bear market lows. Let's check out the charts!
1-Week chart

Image Courtesy: TradingView.com
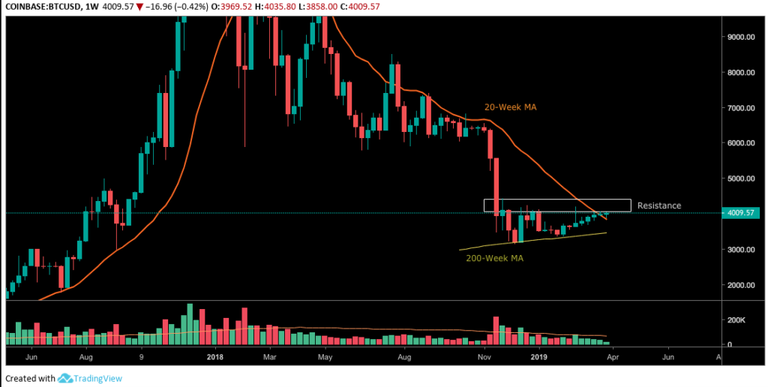
Bitcoin's weekly candle chart still shows the zone of resistance in the low $4,000 range that the cryptocurrency has struggled with, especially over the past few weeks in particular. Price has approached that level multiple times, but has failed to break through with conviction and close above it.
The 20-week moving average (MA) shows some very interesting data. Last week's candle broke up through the MA, and this week's candle backtested it, revealing it as a potential new level of support going forward.
In a recent YouTube video, Crypto Crew University pointed out the significance of the 20-week MA for bitcoin. The 20-week MA serves as a level of support during bull runs, and as a level of resistance during bear markets, he explained.
The fact that BTC has crossed the 20-week MA, and even looks to have backtested it as support, could be positive for the coin going forward.
The 200-week (MA) still lies as a possible support level, should price head back down.
1-Day chart

Image Courtesy: TradingView.com
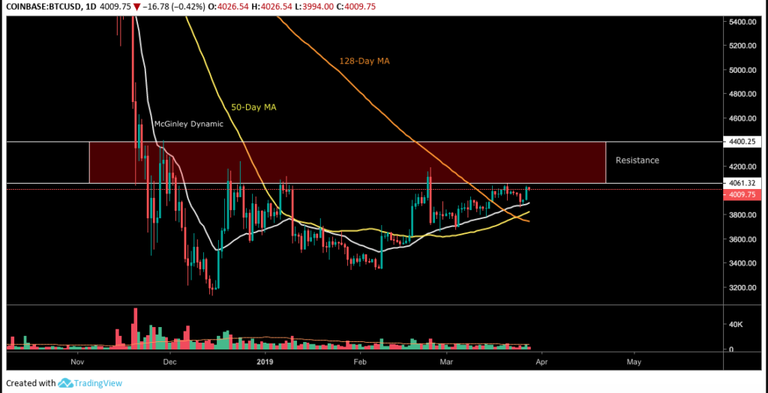
Bitcoin's daily chart shows a more detailed look at the zone of resistance in the low $4,000 range. This week, price made yet another surge upward toward that level, but did not power through it.
Price still sits above the 50-day MA and the 128-day MA. The 50-day MA also shows a firm cross of the 128-day MA.
Additionally, the McGinley Dynamic appears to have acted as support again earlier this week when market valuation dipped down to test it and bounced back up in response. DataDash YouTube host Nicholas Merten pointed out the significance of the McGinley Dynamic in a few of his videos.
4-Hour chart

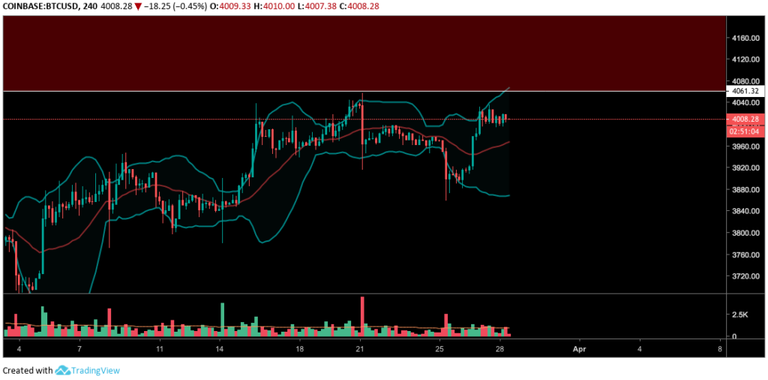
The 4-hour chart for bitcoin shows a bold move up through the middle Bollinger Band on the most recent hard push upward in price.
Market valuation could possibly make another push higher now that it has consolidated for a bit between the middle and upper band. However, the lower $4,000 range, as mentioned above, has given crypto's largest asset a difficult time.
*This article is based on opinions, speculations and interpretations from the author and others, and is not in any way financial advice. Writing about price levels, charts, etc., is purely speculation, subject to speculatory bias. Nothing written is any kind of advice whatsoever. Proceed only at your own risk.
Originally posted on Crypto Insider : https://cryptoinsider.com/bitcoin-knocking-on-the-door-of-key-level/
Lets not forget that the crypto market is being manipulated just like the equity, precious metal and commodity markets. An artificially suppressed crypto market just happens to serve the best interests of the elites and mega enterprises - they are scooping BTC and a few other precious coins up while the market is depressed.