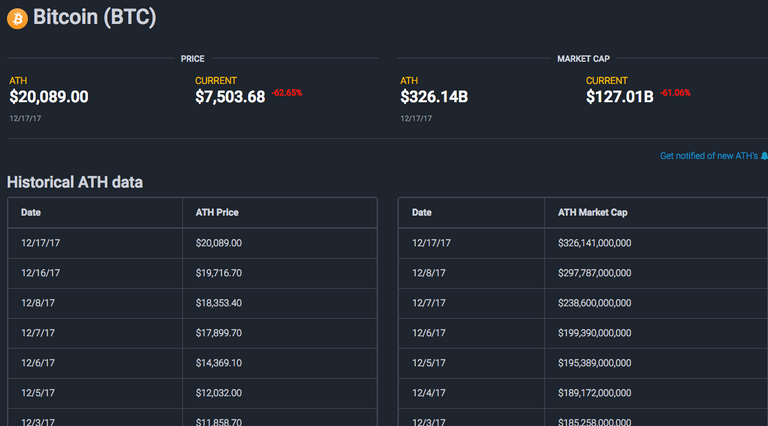
Hello i just check Bitcoin chart and one site where you can see All time high's of every single one cryptocurrency and is not looking good. I dont wanna spreading FUD news just wanna show you what i find.
Bitcoin from historical data never fall lover than 61% from ATH never. It happen few time where we could see almost same graf like We are seeing now. Just check Bitcoin chart and go to end of 2012 till 2014 and use Fibonacci indicator. In this historical data max for drop Bitcoin was 61%. Today Bitcoin reach more than 62% which is scary BUT in the other way in my eyes just more opportunity to accumulate more Bitcoin for long term. From this data we can see also that after reaching -61% we gain in few months new ATH so is possible we will see new ATH for Bitcoin in summer??? Who knows but it is more likely that he will do new ATH than drop to zero. Decision is your my friends.

Disclaimer:
Any market data or commentary used here is for illustrative and informational purposes only. Don't trade with money you can't afford to lose especially with leveraged instruments. The past performance of any trading system or methodology is not necessarily indicative of future results.

Dúfam ,že BTC pôjde to :on the moon!!!! ☻
You got a 10.22% upvote from @minnowvotes courtesy of @cryptoinvestsvk!
Ahoj, našel jsem tabulku, kde jsou uvedeny pády Bitcoinu a je tam dokonce pád o 87 % oproti ATH. Ale pozitivní je, že se historicky vždy ATH překonal, takže nevidím důvod, proč by zase neměl.