The past 24 hours has definitely had everyone on the edges of their seat. Bitcoin down below $6,000.00 is something we haven't seen since February. From Coinbase we technically broke that yearly low from Feb, which was $5873.00 and we just hit $5777.00 as the low.
Going into 6/25 we can see a strong daily recovery, signifying a bottom, or we might breach lower lows.
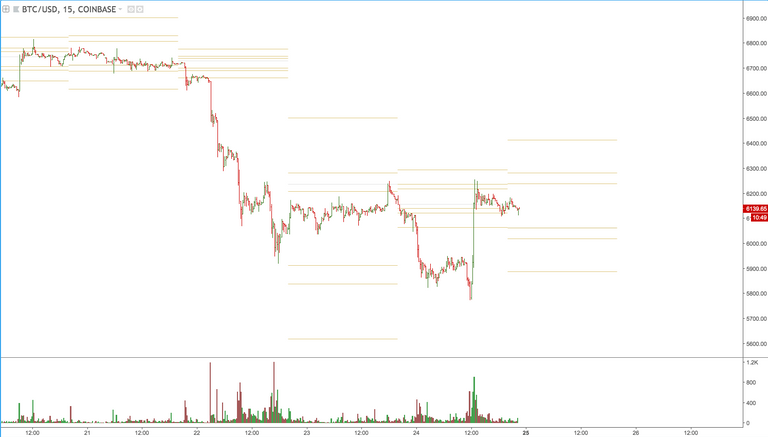
Heres the daily chart with the daily Key Points. 
You can see we will consolidate between the second key support at $6018.00 and the second key resistance at $6281.00. Once those points are broken it will be determining factor of which direction Bitcoin will continue.
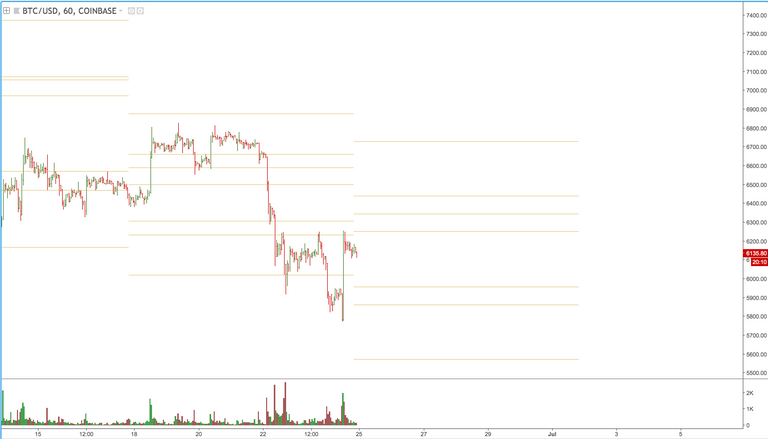
In the weekly Key Points $5859.00 is the second key support and the second key resistance is $6438.00. This will be the larger range that will need to be broken after tomorrows intraday's consolidation range. Below is the chart of the weekly Key Points.

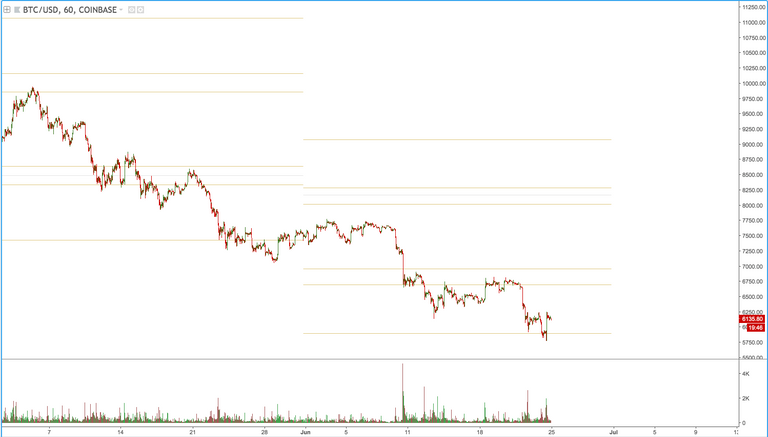
Now for the Month of June we will be able to finish somewhat positively with the hopes of a recovery if we can move upwards towards the second key support point at $6693.00, which has proven itself on 10th, 14th and 19th-21st of this month. The third key support has really held Bitcoin at $5894.00 dipping below just so minimally towards the low of $5777.00. The monthly Key Points you can see the bounce from today looking pretty bullish. If the low is broken those no way of knowing how low Bitcoin will go for the month. The Monthly Key Points are below. 
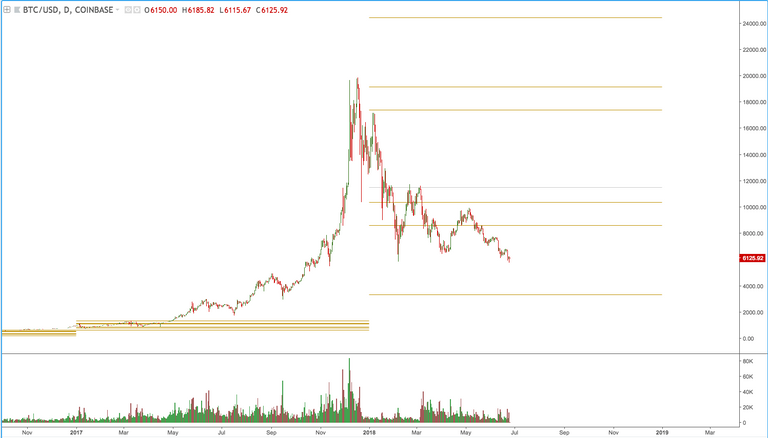
Finally to the big picture. The yearly Key Points show this third bottom between the down range from third key support at $8593.00 to the fourth key support at $3350.00. If this is the last bounce of the year then we should head upwards to the $8593.00 and beyond. If the low of $5777.00 is broken then the Key Points do tell us that support is around $3350.00 which we all should be prepared for as tomorrow sets forth a very important day for Bitcoin. The Yearly Key Points below. 
What do you think about tomorrow and the rest of the year for Bitcoin for that matter?
Also what do think of the Key Points? I hope you are seeing the inner workings mechanically of the market and how you can use it as a tool to help develop a professional mindset by seeing a quantitate framework across all timeframes.
Disclaimer : Please use this as educational means. This is not financial advice and invest doing your own research and using your own discretion.
Definitely a double bottom on the 1day chart that put a little optimism in the market. Whether it's enough to kick the bear is unknown.
Yes we will see soon!