CryptoKraze Technical Analysis

Possibility on 15 Minutes Chart

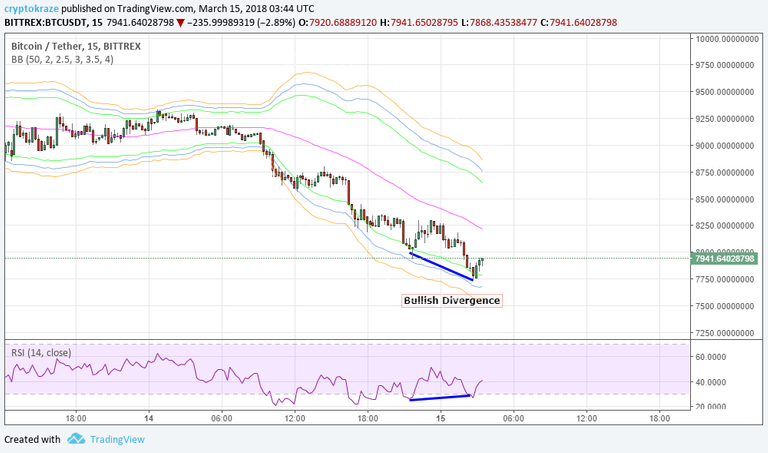
If you look at the 15 minutes chart, you will see that a bullish divergence has formed because price has made lower lows and RSI is making lower high, which mean blue lines are going opposite direction. RSI has gone below 30 level and now moving nicely above 30 level, so I am expecting it to go even higher. Price has touched the lower bollinger bands and now it will move up nicely. I have taken this trade as a scalp to make some quick profit.
- I have a buy entry at $7800 with my profit target around $8100 or above.
- Stop loss just below the entry area is must for trading if you don't know the Averaging Technique in Crypto Trading.
Crypto Trading is risky business and you can loss partial or full amount of money. Trade at your own risk with that money only you can afford to lose. Bitcoin unexpected move will make this analysis void.

Steem Education Initiative is empowering local students of Pakistant through Steem blockchain to give them a chance for better life.
Join SEI at Discord

Follow ADSactly at Discord

wow !! excellent information friend ... what good to know Bittrex ah done that fluctuation in the value of bitcoin ... so investors have an idea about this
thank you very much for the contribution ... and the knowledge obtained
regards
I greatly hope you’re right as the overall markets could use some recovery after all the recent blood shed. I think it’s also probable seeing as tho this is a pretty significant low comparatively to the previous monthly lows and each time a low is reached it is followed by a significant bull run! 🙏
Nice tips, thanks
We got the China ban, mt gox selling off 400,000 bitcoins and a few other things which are conspiring to lower the crypto prices.