Hello all,
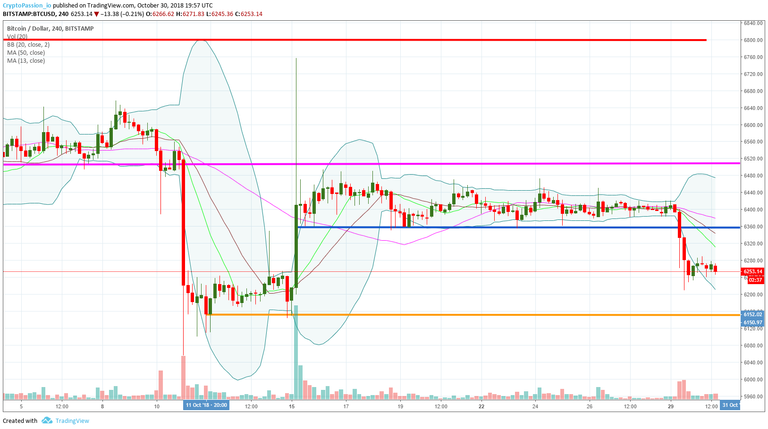
Here is the chart of yesterday :
Here is the current chart :
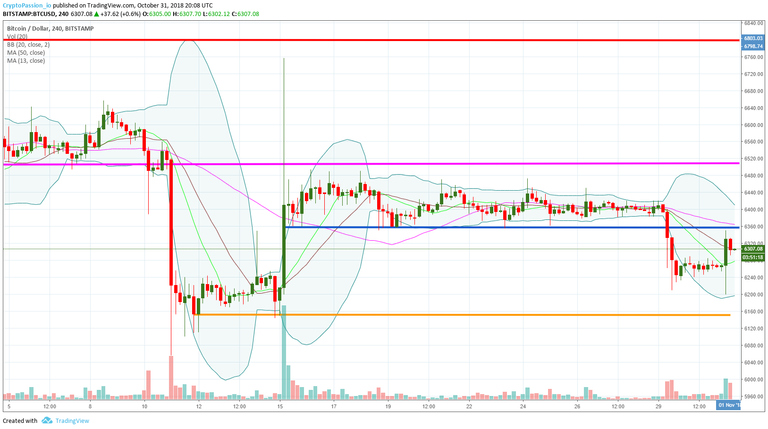
The BTC just had a little bounce and is trying to test the resistance line in Blue and come back inside the trading canal. Till now this line is not broken but we should test it again very soon. The break would be very nice as it would allow us to go back in the trading canal and be prepared for the next break out which could be a UP break out this time.
I wish you massive profits,
Cryptopassion.io
Disclaimer : Never invest more than what you can afford to lose. This post is my personal opinion, do your own research before making any investment decisions. If you make any trades after reading this post, it is completely in your responsibility. I am not responsible for any of your losses. By reading this post you acknowledge and accept that.

Do you want them spendable directly via a dedicated plastic Visa card ?
Do you want to receive back 0.5% of your spending in Bitcoin ?
I recommend you the platform


.gif)

.gif)
Which software or chart you use to produce your TA?
Posted using Partiko Android
Not OP, but, he uses Trading Views
I believe is free, right?
Engaging idea, friend.
According to how I see the trend and the amplitude of the Bollinger Bands I think we will be testing the support of the $ 6150 and then if we get a recovery.
Such a small time-frame, are you a day trader?