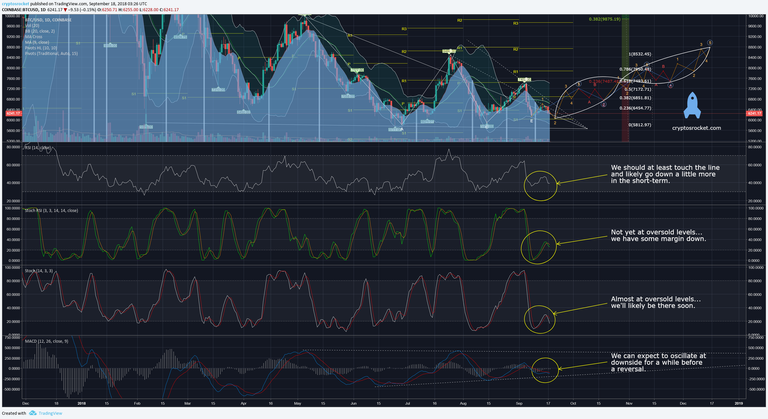
The expected dip is here and we have some margin down. 6K is the next target, but the trend reversal is not too far. As we’re approaching to the end of the triangle, a breakout begins to become more and more likely, but see that it’s still a bit early to create excessive expectation for that.
Let’s take a look at each indicator of our setup…
RSI – We should at least touch the line and likely go down a little more in the short-term.

Stochastic RSI – Not yet at oversold levels… we have some margin down.

Stochastic – Almost at oversold levels… we’ll likely be there soon.

MACD – We can expect to oscillate at downside for a while before a reversal.

The dashed line serves as a guide… see that we haven’t yet reached the expected destination.
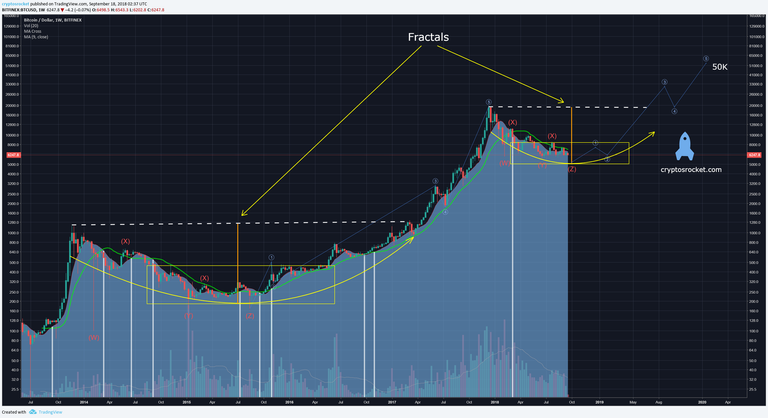
Here is the long-term projection with 1-week candles and logarithmic scale… look that beautiful bullish fractal. We’re getting close to a decisive moment, that can lead us to a new bull run up to 50K!

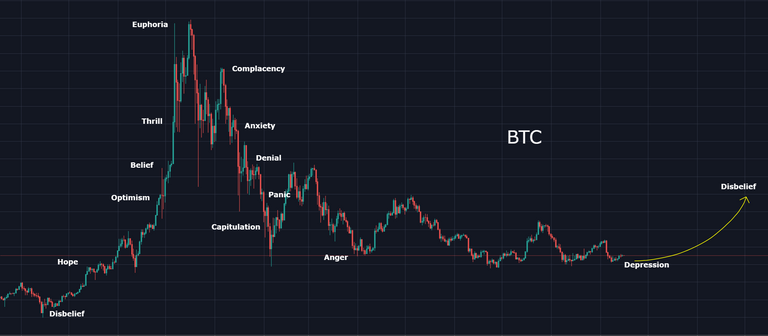
All that said, check how this psychology chart example is almost identical to BTC/USD pair…


Conclusion: We’re anticipating this dip for some time and warning that we still have some margin down before a trend reversal since a few days ago, primarily due to a submerged crossover that indicated a bear flag in the short-term. Today we have reached the level of the last crossing and we should jump into oversold levels soon, but you don’t have to hurry up to board this rocket… the takeoff isn’t imminent.

DISCLAIMER: None of CryptosRocket content is investment or financial advice. Please do your own research before investing and invest at your own risk. Do not invest more than you can afford to lose and consult a financial advisor if necessary.
