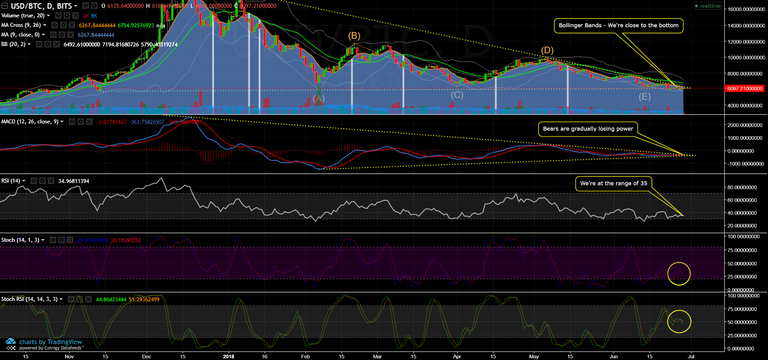
The MACD has shown that bears are gradually losing power… it becomes clear when we draw a line at the top and bottom forming an almost perfect lateral triangle. Thus, we arrived at the point where the convergence and divergence of the moving averages are fused, forming a not very common straight line (especially for BTC). So the price was expected to walk sideways a little bit… and that’s exactly what’s happening at the moment.

Regarding the Bollinger Bands, we’re close to the bottom. What does that mean? That probably no much margin for down… This is BULLISH! The Relative Strength Index (RSI) and the Stochastic indicator corroborates with that.


When we’re over 70 in the RSI, we can consider the price overbought and when we’re under 30, we can consider it oversold. Now we’re at the range of 35… so get your conclusions.
The Stochastic RSI also shows us that we can go down a bit more before a reversal, but it’s not required.

Conclusion: The market doesn’t like indecision and If we fall to ~5.5k, it’s absolutely within the expected. As we’re already at the end of the triangle, a likely breakout is imminent. If we decisively break above 6.5k… so it could be the beginning of a new bull run!

DISCLAIMER: None of the CryptosRocket content is investment or financial advice. Please do your own research before investing and invest at your own risk. Do not invest more than you can afford to lose and consult a financial advisor if necessary.

Source: http://cryptosrocket.com/btc/2018/06/28/bitcoin-btc-update-the-expected-march-of-the-crabs
✅ @cryptosrocket, I gave you an upvote on your post! Please give me a follow and I will give you a follow in return and possible future votes!
Thank you in advance!