This is not Financial advice: Do not trade or invest based on this analysis.
Price
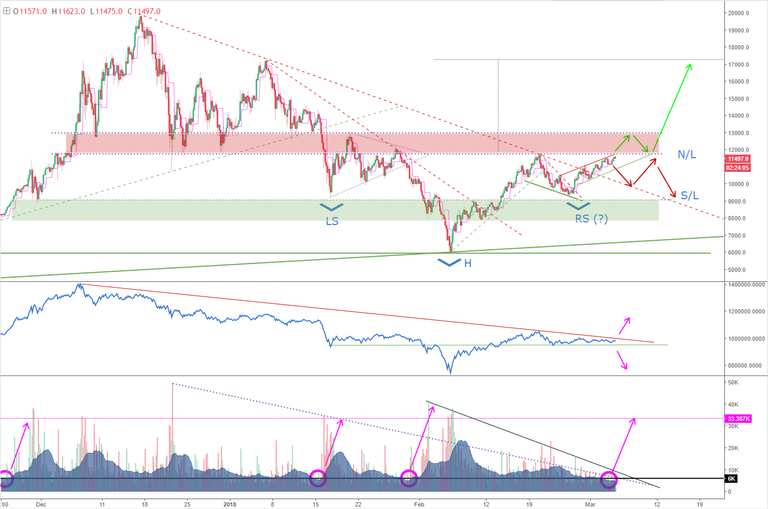
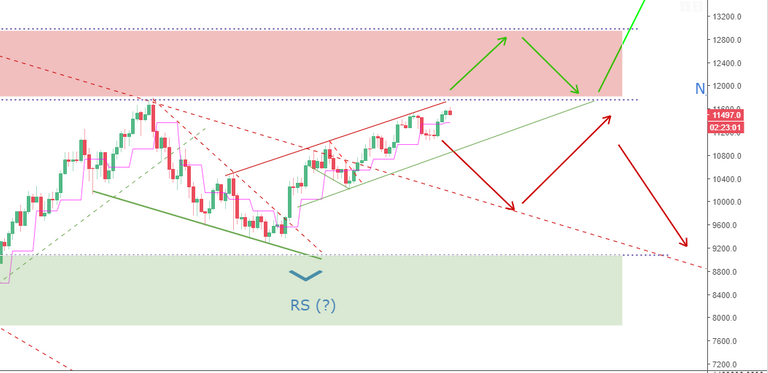
Following from yesterday's review (here) the BTC price is slowly approaching the $12,000 mark. I expect to see some signficant resistance beginning at $11,800 (the red zone marked on the chart):
This also represents the neckline area for the possible inverted head and shoulders pattern.
I would like to see BTC consolidate around these price levels for a bit longer (perhaps forming a triangle), rather than simply breaking through the resistance zone. This would establish a stronger base for a bull run and symmetry for the inverted head and shoulders patter to complete, validating the price target of $17,000.
The short term price action has been subdued in terms of volatility, which isn't necessarily a bad sign for the upside scenario.
Volume
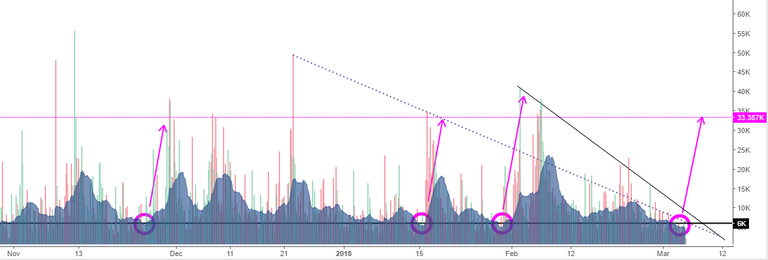
The volume is in a low period (<6k Bitfinex 4hr) and usually comes back with a bang, so keep an eye out for that. I suspect it'll happen in the next three to five days.
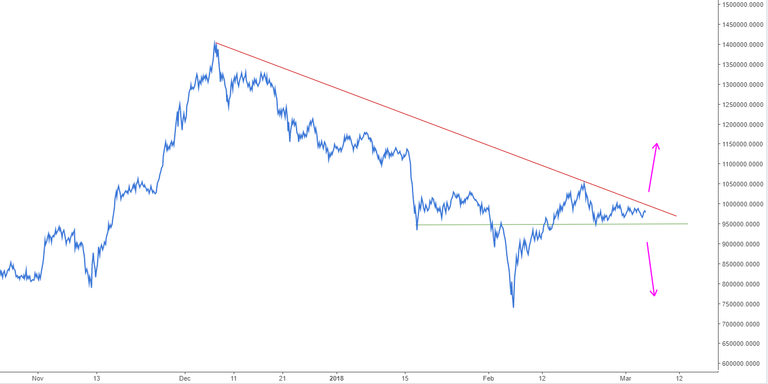
The On-Balance-Volume indicator isn't signalling much other than overall indecisiveness by the Market participants (i.e. accumulation and disaccumulation is flatly balanced).
Bias
I would like to see some further price consolidation between $10,000 and $12,000, but I suspect we'll see some dramatic price action if the price convincingly breaks into the overhead resistance zone, which might lead to some whipsawing in price.
My Bias remains to the long side.
Until tomorrow,
Bobby.


Couldn’t agree more. I still don’t think we can break this wall up without a massive spike in volume. I would like to see one as large as the spike at $6k. That would be plenty, and the test coming back down wouldn’t be a problem. We have to go high enough above $11.8k for breaking it to even matter. If we break it and hold, $17k shouldn’t be a problem. I don’t think we will have nearly as much trouble heading up after that.
All good points @ctom . I'm longing for a bit volume (almost doesn't matter which way), hopefully we'll see some over the next week or so.
Did you notice the larger inverse head and shoulder the smaller one is inside of? We have to go back down first. I still think this small double top will play out forcing us into a huge double bottom is more likely. And we will moon to $17k after, but who knows? There’s also a huge inverse head and shoulders on the LTC monthly.
Yeah, your recent post (here) enlightened me on the possible larger inveres head and shoulders pattern, which if that eventually forms and completes would be pretty incredible. Double bottom scenario is also interesting, I guess the next few days will tell if we manage to get through the overhead resistance (which is just beginning to be tested):
Regarding LTC, yes, I've been keeping an eye on that price action as well, although I tend to focus on LTCBTC cross for relative strength. I've got a bit of a soft spot for LTC so would like to see it do well, especially with the recent announcement of litepay. Exciting times. Keep up your posting @ctom, it's always good to see other people's perspectives and analyses.
Thanks man. I appreciate it. It also looks like so far I’m right. I’ve changed my analysis slightly due to a recent finding it. Head over and check it out.
Hi!
I followed and upvoted you.
Follow me back and we both can help each other succeed on Steemit!