Hello everyone,
I was quiet about crypto for almost 2 years since I got out of hodlings in the range of $12-16k (pretty much nailed it with accuracy :)). That was the third btc rally since 2011 in which I was involved.
Now I want to show you the next context which is forming.
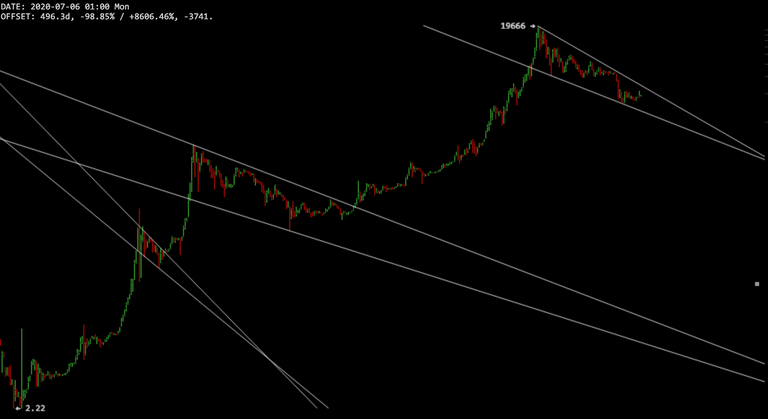
Again we will look at the largest weekly chart using logarithmic view. I have placed marks for previous bubble bursts in the pic, first is drop from $260 to 60, second is drop from $1000 to 150, and the third drop is what is happening in the moment from $20k to 3k.
Now, what interests the most, is that we are pretty close to trend reversal. These are great news, we are highly unlikely to see price noted less than $2k (maybe in some case just for a second), but the crossroad is ahead or even behind the corner. I'm picking now a tactic for next fiat to crypto action and hodl.
Check it out, cheers. :)
