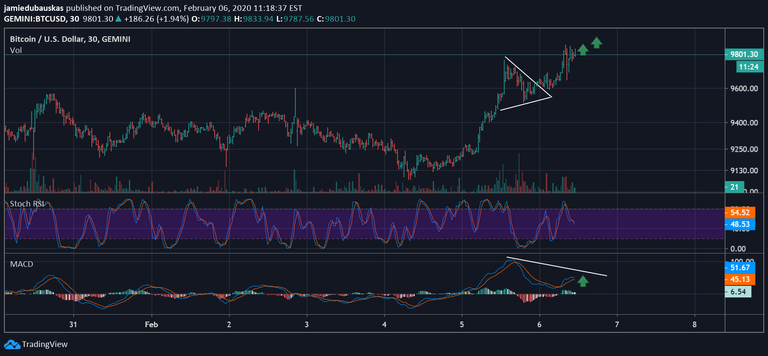
Updating the analysis that I posted here yesterday, Bitcoin has shown some good bullish signs. Signaling that it will cross the $10k psychological resistance and to the normal resistance of $10,500. If this one more move upwards makes the MACD rise above the 104.78 level that was created yesterday (2/5/2020), then it is possible that the upwards moves can still happen. Maybe to the $12,300 resistance level.
Otherwise, if the MACD doesn't surpass the level that was made yesterday, then that is a clear bearish divergence on the 30 minute chart. That only means that in the short term, Bitcoin will need to see a little lower before reaching higher towards the $12,300 level.
Also, here is the analysis that I posted here yesterday for context: https://steemit.com/btc/@divingman25/bitcoin-short-term-analysis-february-5th-2020
If you liked this analysis, upvote & go subscribe to my podcast on YouTube where I post weekly market updates and crypto news: https://www.youtube.com/channel/UC8i0EY5M_9NKdYMnS2Y0yqw
From my view, BTC is now crossing its daily trend lines with room which opens the long term bull. But ETH did it earlier and is much more profitable since the last weeks. And this is what the graph shows clearly when you face ETH to BTC. It looks like one has clearly taken the advantage (at least for now).
Nice analysis! I don't really mess with altcoins though...