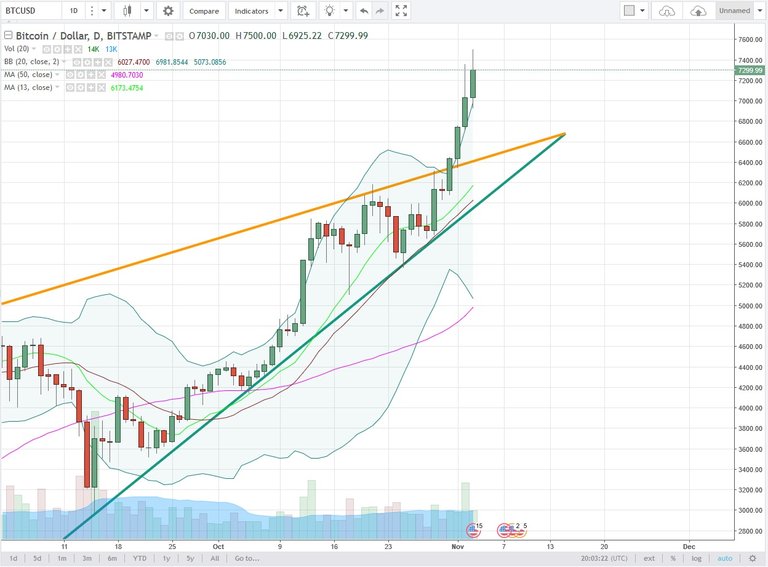
If I am not mistaken that's a 4h timeframe, wonder how the 1d to 5d graph looks, coz a fall of $500 is pretty drastic in the absence of fundamental news imho.
You are viewing a single comment's thread from:
If I am not mistaken that's a 4h timeframe, wonder how the 1d to 5d graph looks, coz a fall of $500 is pretty drastic in the absence of fundamental news imho.
Yeah you are right this is the 4h timeframe.
Here is the daily chart.

We need at least to touch the MMA13 (fluo green) before continuing the up. This is at least my opinion. I wish you the best ;)
Thank you for extra work, indeed looks like priming for reversal. Likewise)