Very interesting, i think it might go a little downer first.
I'm discerning a potential H&S pattern on the 30min chart, it also looks like its completing a bearish flag.
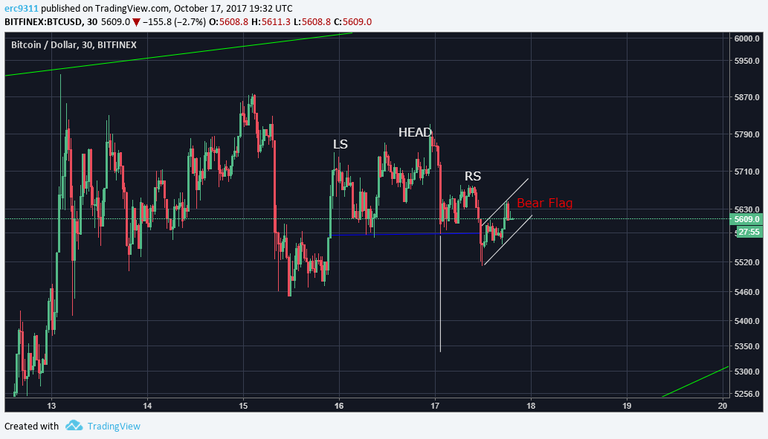
Let's see how it plays, thanks a lot.
Very interesting, i think it might go a little downer first.
I'm discerning a potential H&S pattern on the 30min chart, it also looks like its completing a bearish flag.
Let's see how it plays, thanks a lot.
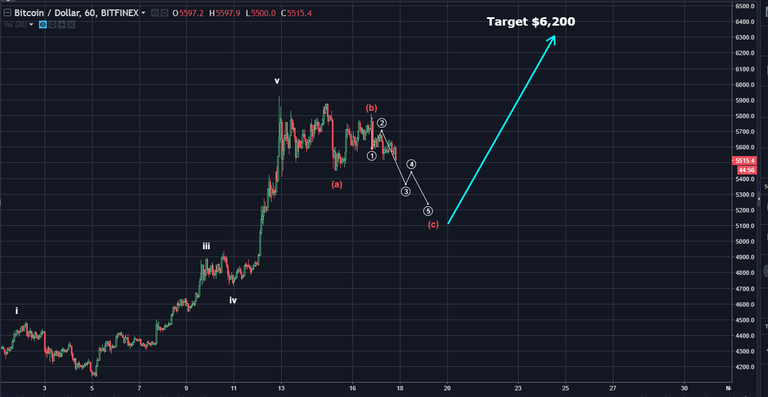
Yes, the H&S Top is apparent, thanks for posting. The Elliott Wave correction coudl turn out to be like below; but the 1.618 Fib at $6,200 should still be the upper target. This is a correction.