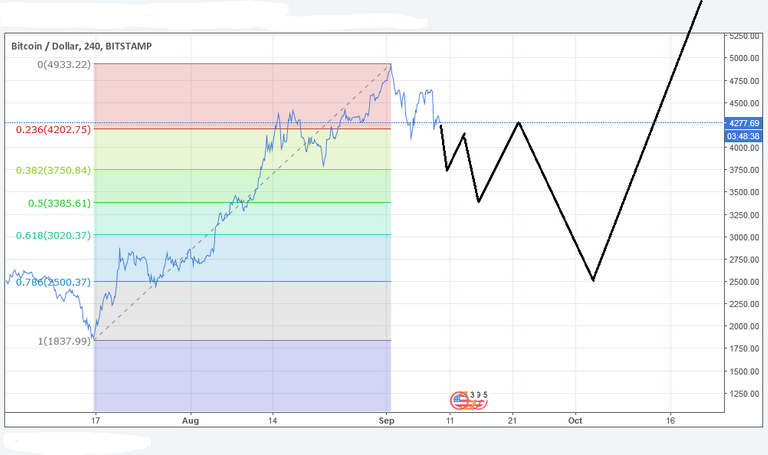
The BTC chart is not looking good anymore. Today I wanna warn you about a bearish scenario, because I found that there is a cluster zone at 2500$.
What is a cluster zone you may ask? It is a zone where two or more target Fib levels of different moves (or waves) coincide to be at the exact same level.
In BTC the 78% correction level of the last move up happens to be at 2500$. You guessed it right. This coincides with the 50% correction of the alltimehigh.
IT DOES NOT HAVE TO turn out like this, because there are many different types of corrective moves that can occur. But I have found such cluster zones to be like a magnet in many different cases. If you don't see more downside in BTC, just forget this target again, but if it continues, this is the most likely correction target besides 3000$.

If this happens, an end of the year rally would make perfect sense, new alltimehighs included.
Stay tuned for more updates...
.png)
If you think this to be useful information:

.png)
DISCLAIMER: I provide trading ideas using EW and Pattern analysis. The material in this post does not constitute any trading advice whatsoever. This is just the way I see the charts and what my trading ideas are. The author of this post is holding positions in this market at the time of this post.
If you make any trades after reading this post it is completely in your responsibility. I am not responsible for any of your losses. By reading this post you acknowledge and accept that.
Tell me what you think...
Have a nice day :-)
I think the $2500 level is such a strong support level that it is possible we could get back there. I hope so because that's about where I sold a significant ( for me) amount of my BTC holdings. Missed out on all these gains to the ATH.
Bitcoin has made fools of more bears than bulls. The best strategy is a long term hodl.
correction to 2500 is too deep, it will go to 3500
Sell sell!
Yeah, think so, too... Though, I would't mind BTC falling like that so I can buy in again :D
Bitcoin never corrected more than 35-40% from ATH in last 3 years. 50% would be such crash :\
You could be right. Personally I think its to early to say that. If you are drawing a line from the pinbar Low of Aug. 22 to the bar Low of Aug. 5: there is no Close under this line until now. And then I speculate of the Fib 78 round about 4000.-, measured from the pinbar mentioned before. — Alternativley there could be emerging a SHS-figure. And then, we will see BTC downhill. — We will see... Good luck to all traders!
@originalworks
To call @OriginalWorks, simply reply to any post with @originalworks or !originalworks in your message!
To nominate this post for the daily RESTEEM contest, upvote this comment!
For more information, Click Here!
its going back to 5k I'm going against the grain here!
I think that might be as much of a correction as is coming, that's my prediction.
But, who can be sure.
50% is not Fib number.