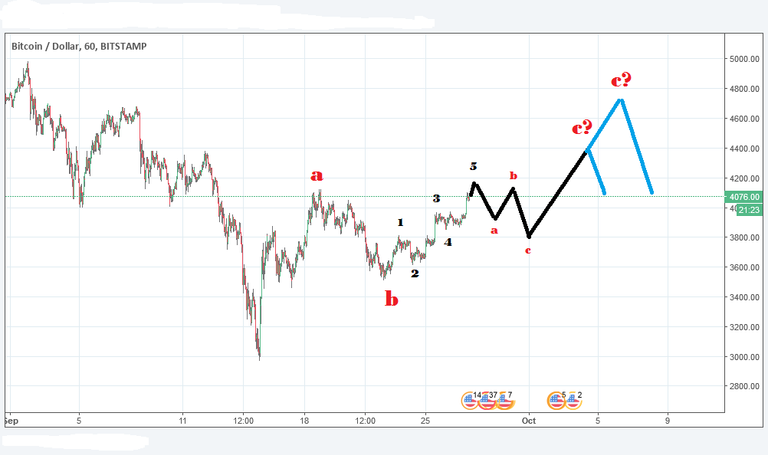
BTC chose to make 5 waves up and stop my short out. For those who follow, you know that I reduced my shorts to half this morning before it was stopped out later:
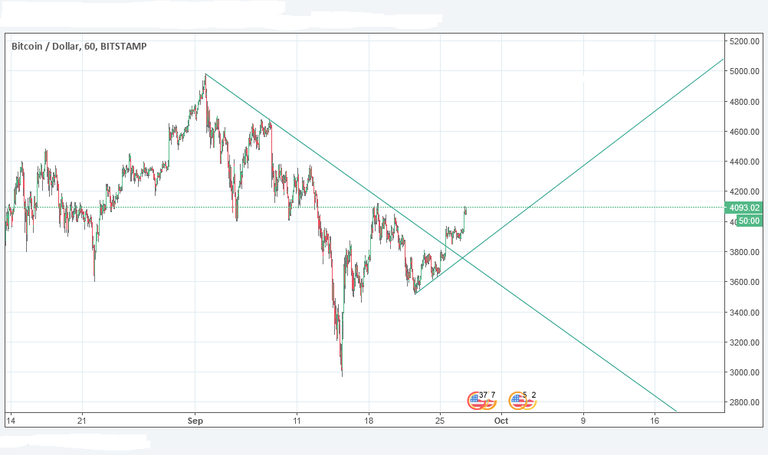
Morning Update: I don't think this is going to work out. I reduced the short to half. Think it will be stopped out soon. Will have to reevalueate in the evening. The bulls are keeping BTC above the trendline, which is bullish...
So now I had to reevaluate. This is what I think is most likely going to happen to BTC now:

I am now looking to buy the next bigger correction (abc red).
There is a possibility for this to turn even more bullish soon. Meaning not abc but bigger 1-2-3
The trendline has been breached and the MACD has turned bullish too, as @haejin noticed yesterday.

Stay tuned for more updates
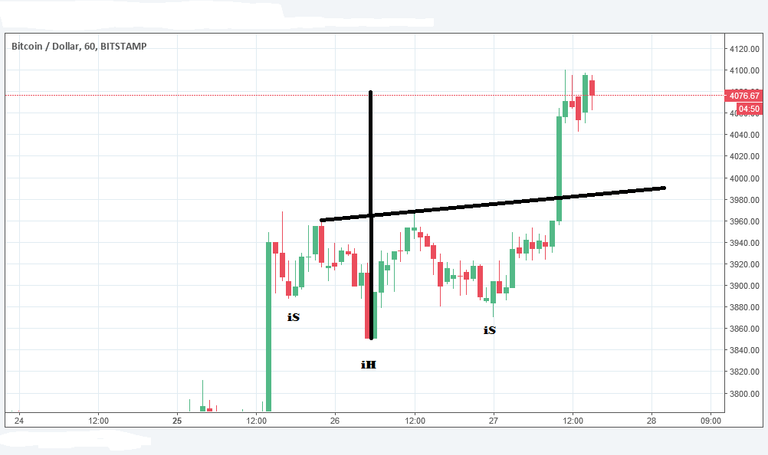
UPDATE: I also found an inverse SHS pattern, but the minimum target is already hit:

.png)
If you think this to be useful information:

.png)
DISCLAIMER: I provide trading ideas using EW and Pattern analysis. The material in this post does not constitute any trading advice whatsoever. This is just the way I see the charts and what my trading ideas are. The author of this post is holding positions in this market at the time of this post.
If you make any trades after reading this post it is completely in your responsibility. I am not responsible for any of your losses. By reading this post you acknowledge and accept that.
Tell me what you think...
Have a nice day :-)
Oké, so this means no more cheap Steem?
i guess not. steem is pumping even harder than btc
Steem has not broken the trend yet. A breakdown is still in the picture
Nice Work! Upvoted! Always good to see a fellow Elliotician's analysis. The inverse H&S combines well with an ascending right triangle potential as well.
Based on EW.. you might see $2800 before $4800. Long-term sentiment has not risen much since the $3600 low was made. Yet the short-term signal has already hit the top. This is a potential reset for a downside move.
Here is the count for that scenario:

A 4th wave can also be an expanded flat, diagonal, or Symmetrical Triangle. 3 wave structure for (a) and (b) is of 3 wave pattern, so high probability it will be another 3 wave push lower, so possible scenarios is that price stays above the $3000 low and possibly expand into a (c,d,e) symmetrical triangle.
Closed my shorts while BTC was breaching $3900 level. My ETH leveraged long position and EOS is doing well. As a matter of principle I don't invest in BTC. At least now the Alt-coins can breathe.
That triangle turned bears into bulls!
This post received a 3.64% upvote from @randowhale thanks to @ew-and-patterns! To learn more, check out @randowhale 101 - Everything You Need to Know!
@ew-and-patterns got you a $8.16 @minnowbooster upgoat, nice! (Image: pixabay.com)
Want a boost? Click here to read more! @originalworks
The @OriginalWorks bot has determined this post by @ew-and-patterns to be original material and upvoted it!
To call @OriginalWorks, simply reply to any post with @originalworks or !originalworks in your message!
To enter this post into the daily RESTEEM contest, upvote this comment! The user with the most upvotes on their @OriginalWorks comment will win!
For more information, Click Here!
Special thanks to @reggaemuffin for being a supporter! Vote him as a witness to help make Steemit a better place!
This technical analysis is quite rational, thanks for sharing your thoughts.
haejin called this move up - he is always spot on !
This is not an exact science... I think it is impossible to predict the market prices, i guess those who where skeptical about the patterns are not so stubborn after all... ;)
Thanks for the update.
You think the bears are still in the hide then.
If this market turns back down and under 3500 then it must be the best trap so far.
You should do these analysis on Steem :)
Upvoted and Resteemed