Regular daily update on BTC ta analysts opinions.

My summary - short-term sentiment: bullish (last: bullish)

Move up came to a hold and is consolidating around 8'000.
All analysts turned short term bullish. Most of them consider the bottom has been found.
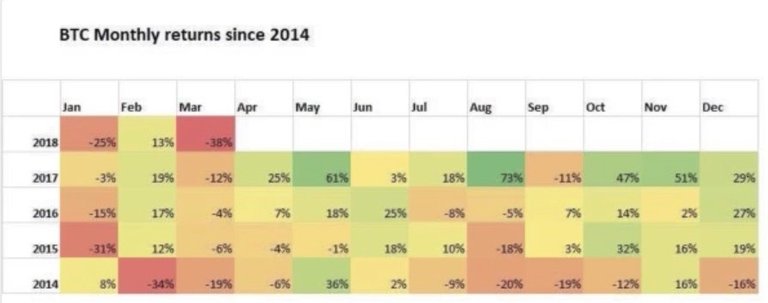
Tone who see's an equal move as in 2014 where this move would end in a bull trap isn't convinced that we have found the bottom yet.
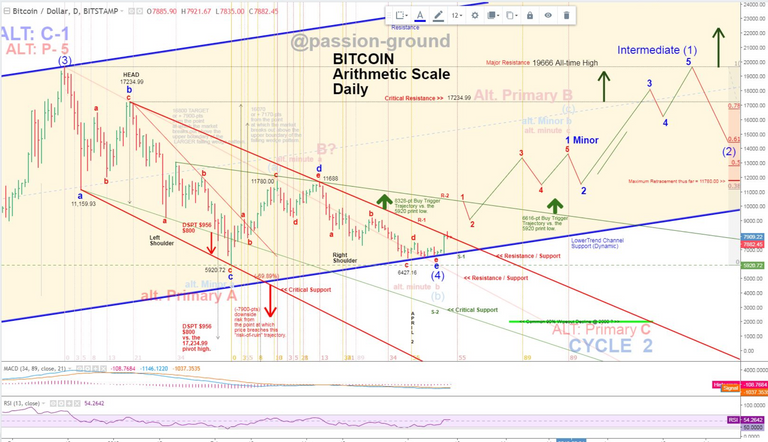
@passion-ground is also mid-term bearish. He still sees a valid pattern leading to lower lows. But short-term he is bullish.
April is used to be a good month for crypto. Lets see how this turns out this time.
News about the blog
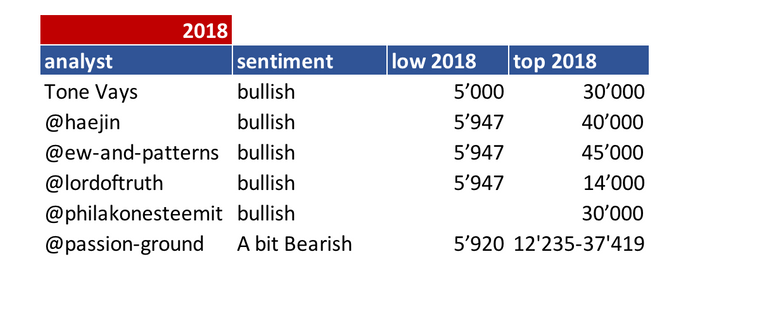
I need to revise my 2018 long term table. I need to add a 2018 and 2019 target an be more precise on the sentiment here. Will do that after I am back in Switzerland.
We lunched the bounty project beta. If you are interested and you like to create a bounty on your own have a look at this post
Analysts key statements:
Tone:
- Weekly: Stays clearly bearish.
- Daily: Massive resistance is mounting - 50 MA, 200 MA which has proven as very relevant for bitcoin, fib line, log down trend and some others. He stays bearish and very sceptical of current move.
@haejin:

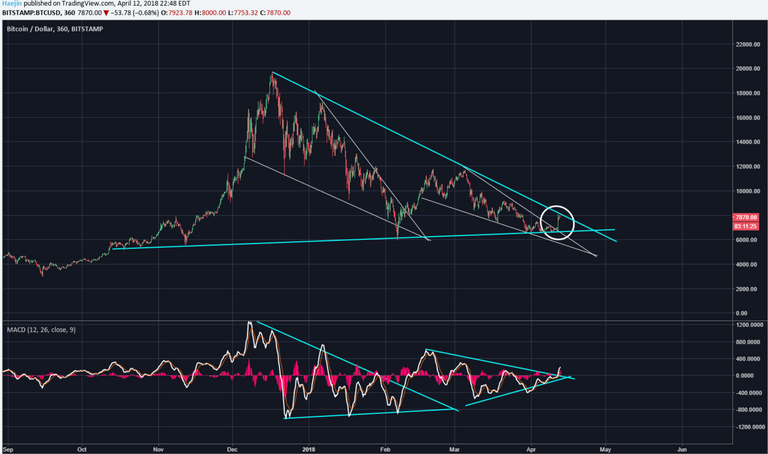
Bitcoin broke out of the upper resistance line of the second wedge pattern. MACD supports.
Next the upper blue line needs to be broken.
@ew-and-patterns:

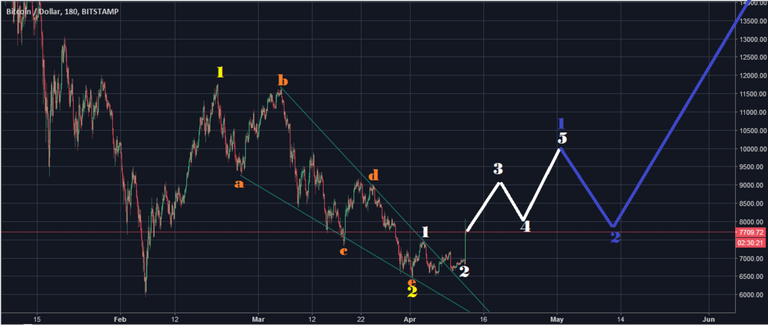
He sees his alternate bull count activated. This one is valid until 6'760 is breached to the downside.
@lordoftruth:
He believes a ping pong move between 7'380 and 8'260 is what we are going to get next. He expects a pull back to the 7'300 region - an opportunity to take long positions. Momentum indicator is in the process of forming a higher swing high.
Todays trend is bullish. Expected trading for today is between 7'380 and 8'260.
@philakonesteemit:
We reached 8'250 and see dangerously overbought conditions. A correction is more likely than another wave up.
@passion-ground:
Is the latest "pop" a precursor toward new all-time highs or is it simply the beginning of a bearish counter-trend trend rally amidst and elongated bear market?
He sees both scenarios as viable prospects. More indication from price action is needed.
Summary of targets/support/resistance

Reference table
| analyst | latest content date | link to content for details |
|---|---|---|
| Tone Vays | 13. Apr | here |
| @haejin | 13. Apr | here |
| @ew-and-patterns | 12. Apr | here |
| @lordoftruth | 14. Apr | here |
| @philakonesteemit | 13. Apr | here |
| @passion-ground | 14. Apr | here |
Definition
- light blue highlighted = all content that changed since last update.
- sentiment = how in general the analysts see the current situation (bearish = lower prices more likely / bullish = higher prices more likely)
- target = the next (short term) price target an analysts mentions. This might be next day or in a few days. It might be that an analyst is bullish but sees a short term pull-back so giving nevertheless a lower (short term) target.
- support/res(istance) = Most significant support or resistances mentioned by the analysts. If those are breached a significant move to the upside or downside is expected.
- bottom = -> now renamed and moved to long term table. Low 2018
- low/top 2018 = what is the low or the top expected for 2018?
Further links for educational purposes:
- From @ToneVays: Learning trading
- From @philakonecrypto: Like in every post you find links to his amazing educational videos. For example here
- From @lordoftruth: Fibonacci Retracement
- From @haejin: Elliott Wave Counting Tutorial
*If you like me to add other analysts or add information please let me know in the comments.
Excellent thank you very much for this detailed analysis and great help to those who are starting in the world of cryptocurrencies. @famunger Happy to read and understand this post
Looking forward to your new long-term table. Upvoted and Resteemed.
Again, great post